.jpg)
Share this article:
Understanding site analytics
Site analytics help you understand how people use your website. They record where visitors come from, which pages they view, what they click, where they leave, and you can use that data to form a hypothesis around what changes you should make to your website to improve conversion.
Failure on a website is silent. Nobody writes in to say your product photos weren't convincing or that the shipping cost showed up too late. They just leave, and the only trace is a number inside a report that's been sitting unopened for weeks.
Take a store with 20,000 visits and 300 orders a month. Move that to 330 orders, and you've grown revenue 10% with no extra traffic, no bigger ad budget, no new products. Getting that same result from traffic alone means finding 2,000 more visits this month, and every month after, permanently.
This article covers what data you already have, which metrics actually matter, which tools collect them, and how to turn those numbers into decisions instead of another dashboard you never open.
Three kinds of data your site collects
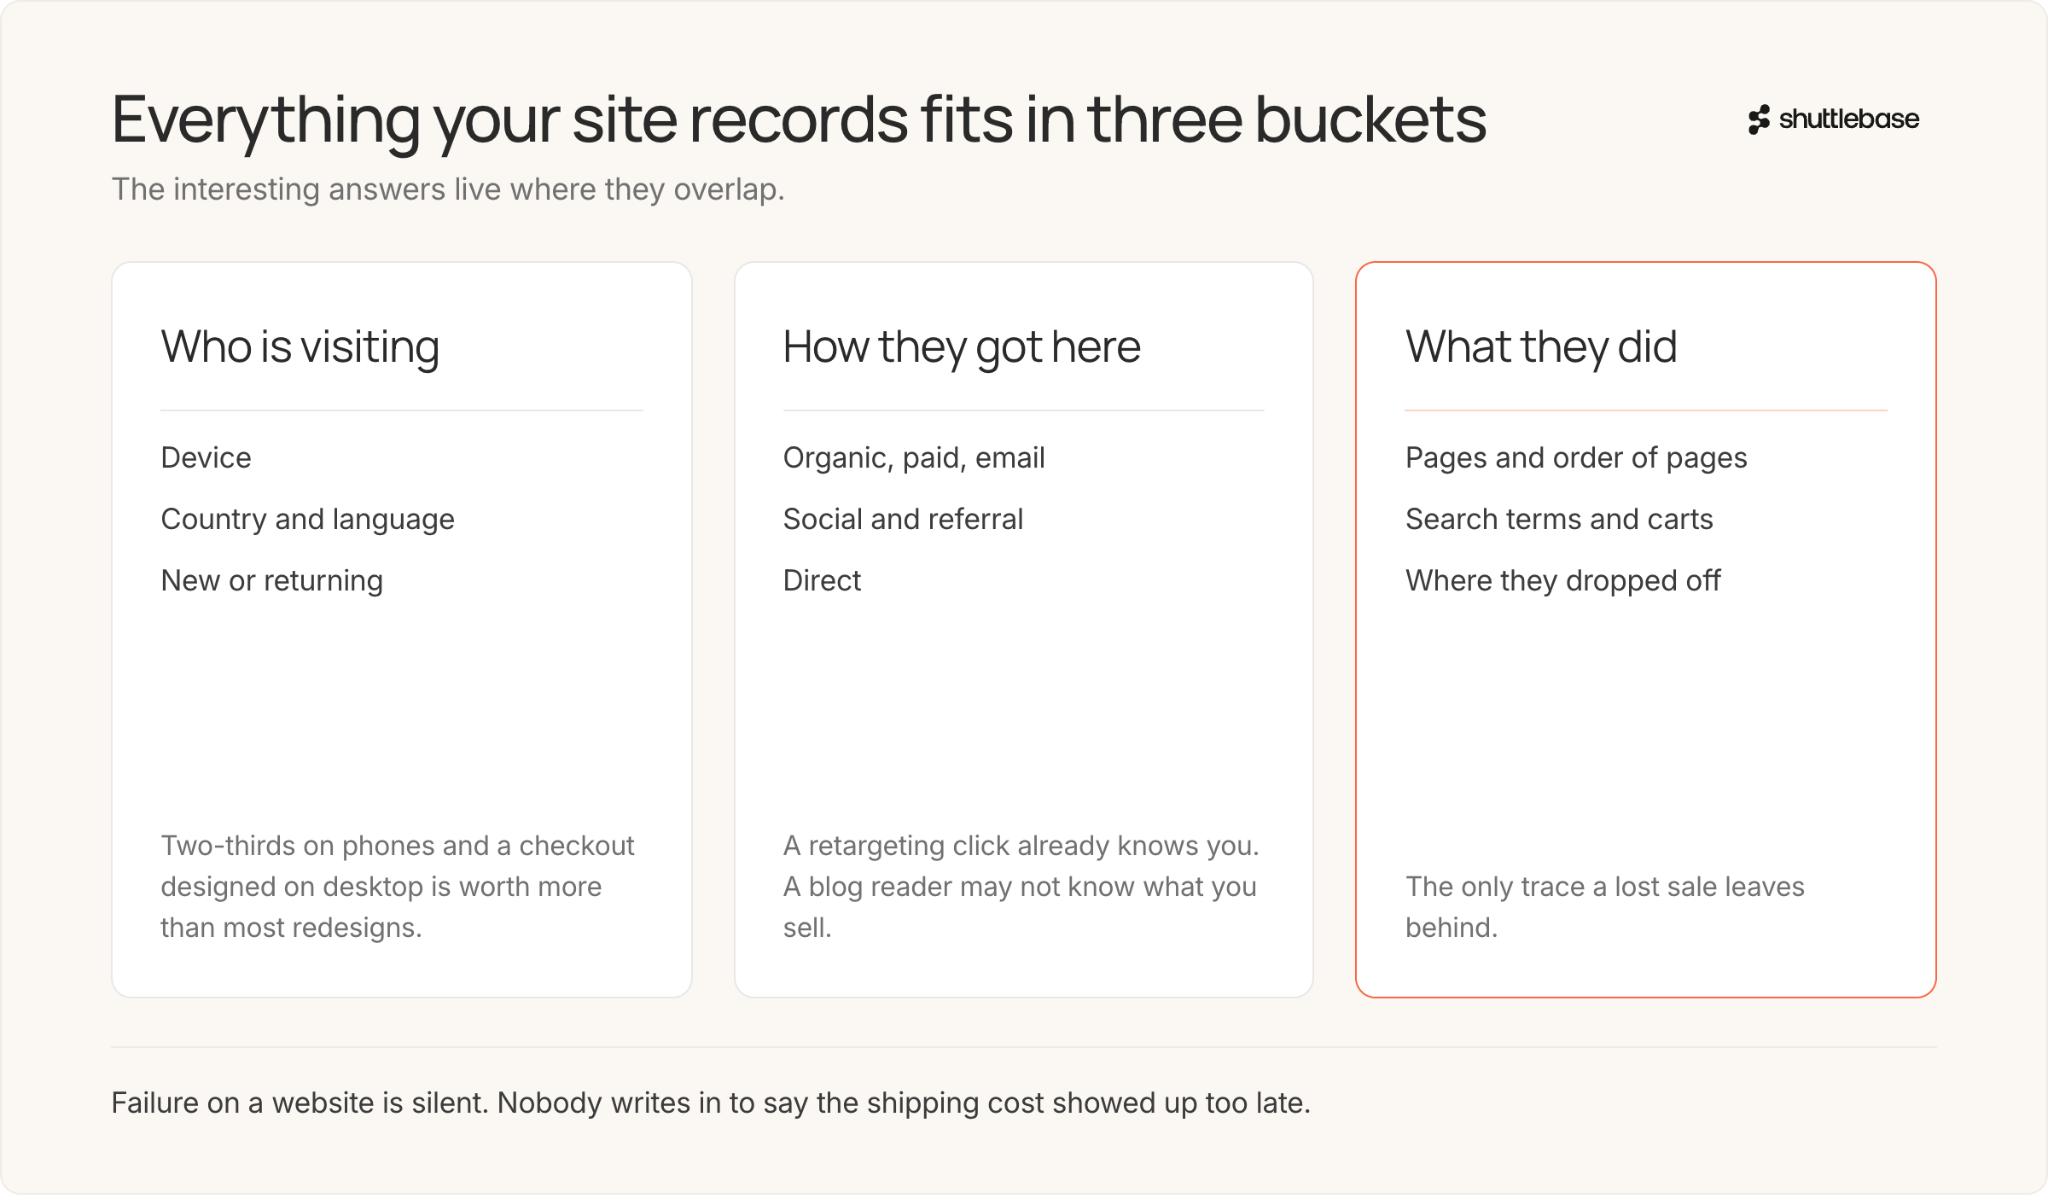
Everything your analytics tool collects fits into three buckets.
Who is visiting. What device they're on, what country they're in, what language they speak, whether they've been here before. If two-thirds of your visitors are on phones and your checkout was designed on a desktop, that one number is worth more than most redesigns.
How they got here. Organic search, paid ads, email, social, a link from another site, or typed your URL directly. Each channel brings people with different intentions. Someone clicking a retargeting ad already knows you. Someone landing from a blog post might not even know what you sell yet.
What they did. Which pages they viewed and in what order, how long they stayed, whether they added anything to a cart, what they typed into search, and where they dropped off.
These three groups connect, and looking at how they interact tends to surface things you wouldn't spot in any single report.
Six metrics worth knowing
Most ecommerce teams have more data than they know what to do with, and the numbers that matter often get buried. These six cover the foundation.
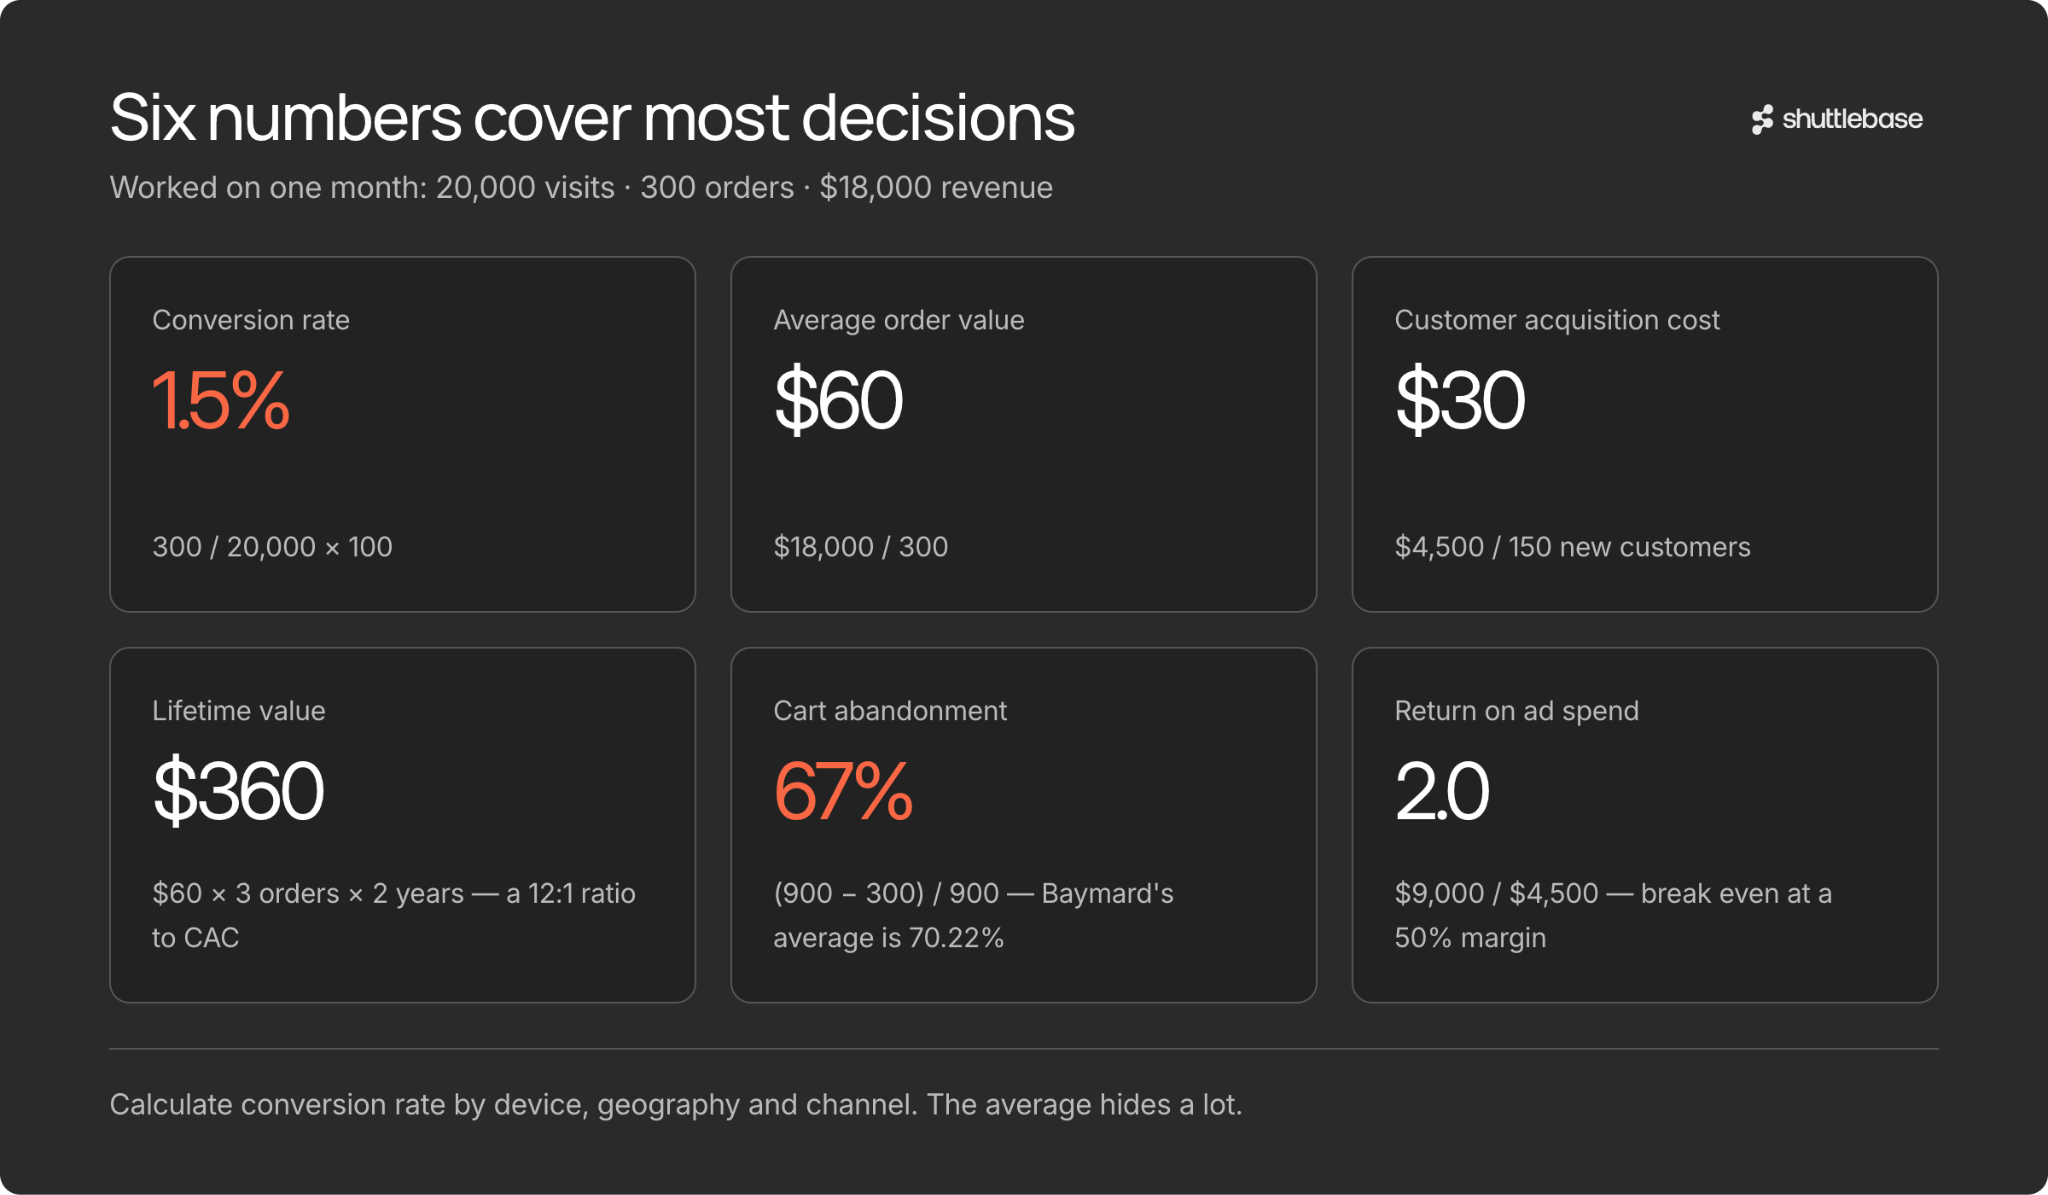
We'll use the store from earlier: 20,000 visits, 300 orders, $18,000 in revenue last month.
Conversion rate. The percentage of visits that end in a purchase. Divide conversions by visits and multiply by 100: 300 / 20,000 = 1.5%. Calculate this separately by device, geography, and channel because averages hide a lot.
Average order value (AOV). Total revenue divided by orders: $18,000 / 300 = $60. AOV is the fastest lever most businesses have. A bigger purchase from someone you already paid to acquire costs you nothing extra.
Customer acquisition cost (CAC). What you spend to get one new customer. Total marketing and sales spend divided by new customers: $4,500 / 150 = $30. Include agency fees, software licenses, and whoever runs the ads. If you leave those out, the number is lying to you.
Customer lifetime value (LTV). What one customer is worth over their full relationship with your store. Average order value times orders per year times years they stay: $60 x 3 x 2 = $360. LTV only matters when you compare it to CAC. A $360 LTV against a $30 CAC is a 12:1 ratio. Below 3:1 and you're acquiring customers you can't actually afford.
Cart abandonment rate. How many started carts never became orders. Subtract orders from carts, divide by carts: 900 carts minus 300 orders is 67% abandoned. That sounds high, but Baymard Institute puts the average at 70.22% across 50 studies. The recoverable share usually lives in the friction between cart and confirmation: surprise costs, required account creation, confusing checkout forms.
Return on ad spend (ROAS). Revenue per ad dollar. Ad revenue divided by ad spend: $9,000 / $4,500 = 2.0. Two dollars back for every one in. Whether that's good depends on your margin. At a 50% margin, a 2.0 ROAS is break-even.
Tools to cover the basics
You don't need a dozen analytics tools. Start with three categories in this order, and add more only when these stop answering your questions.
A web analytics tool. Google Analytics 4 is free and it's the industry standard. Install it and make sure ecommerce tracking is turned on.
Your platform's own reports. Shopify, WooCommerce, and BigCommerce all have access to data that GA4 doesn't see: orders, refunds, product-level margins, and fulfillment data.
A tag manager. Google Tag Manager lets you change what you track without editing your site's code or waiting for a developer. Adding a new event goes from a sprint ticket to a ten-minute job.
Don't expect every tool to report identical numbers. Each measures traffic a little differently. Pick one as your source of truth and use the others to fill in what it misses.
After the fundamentals
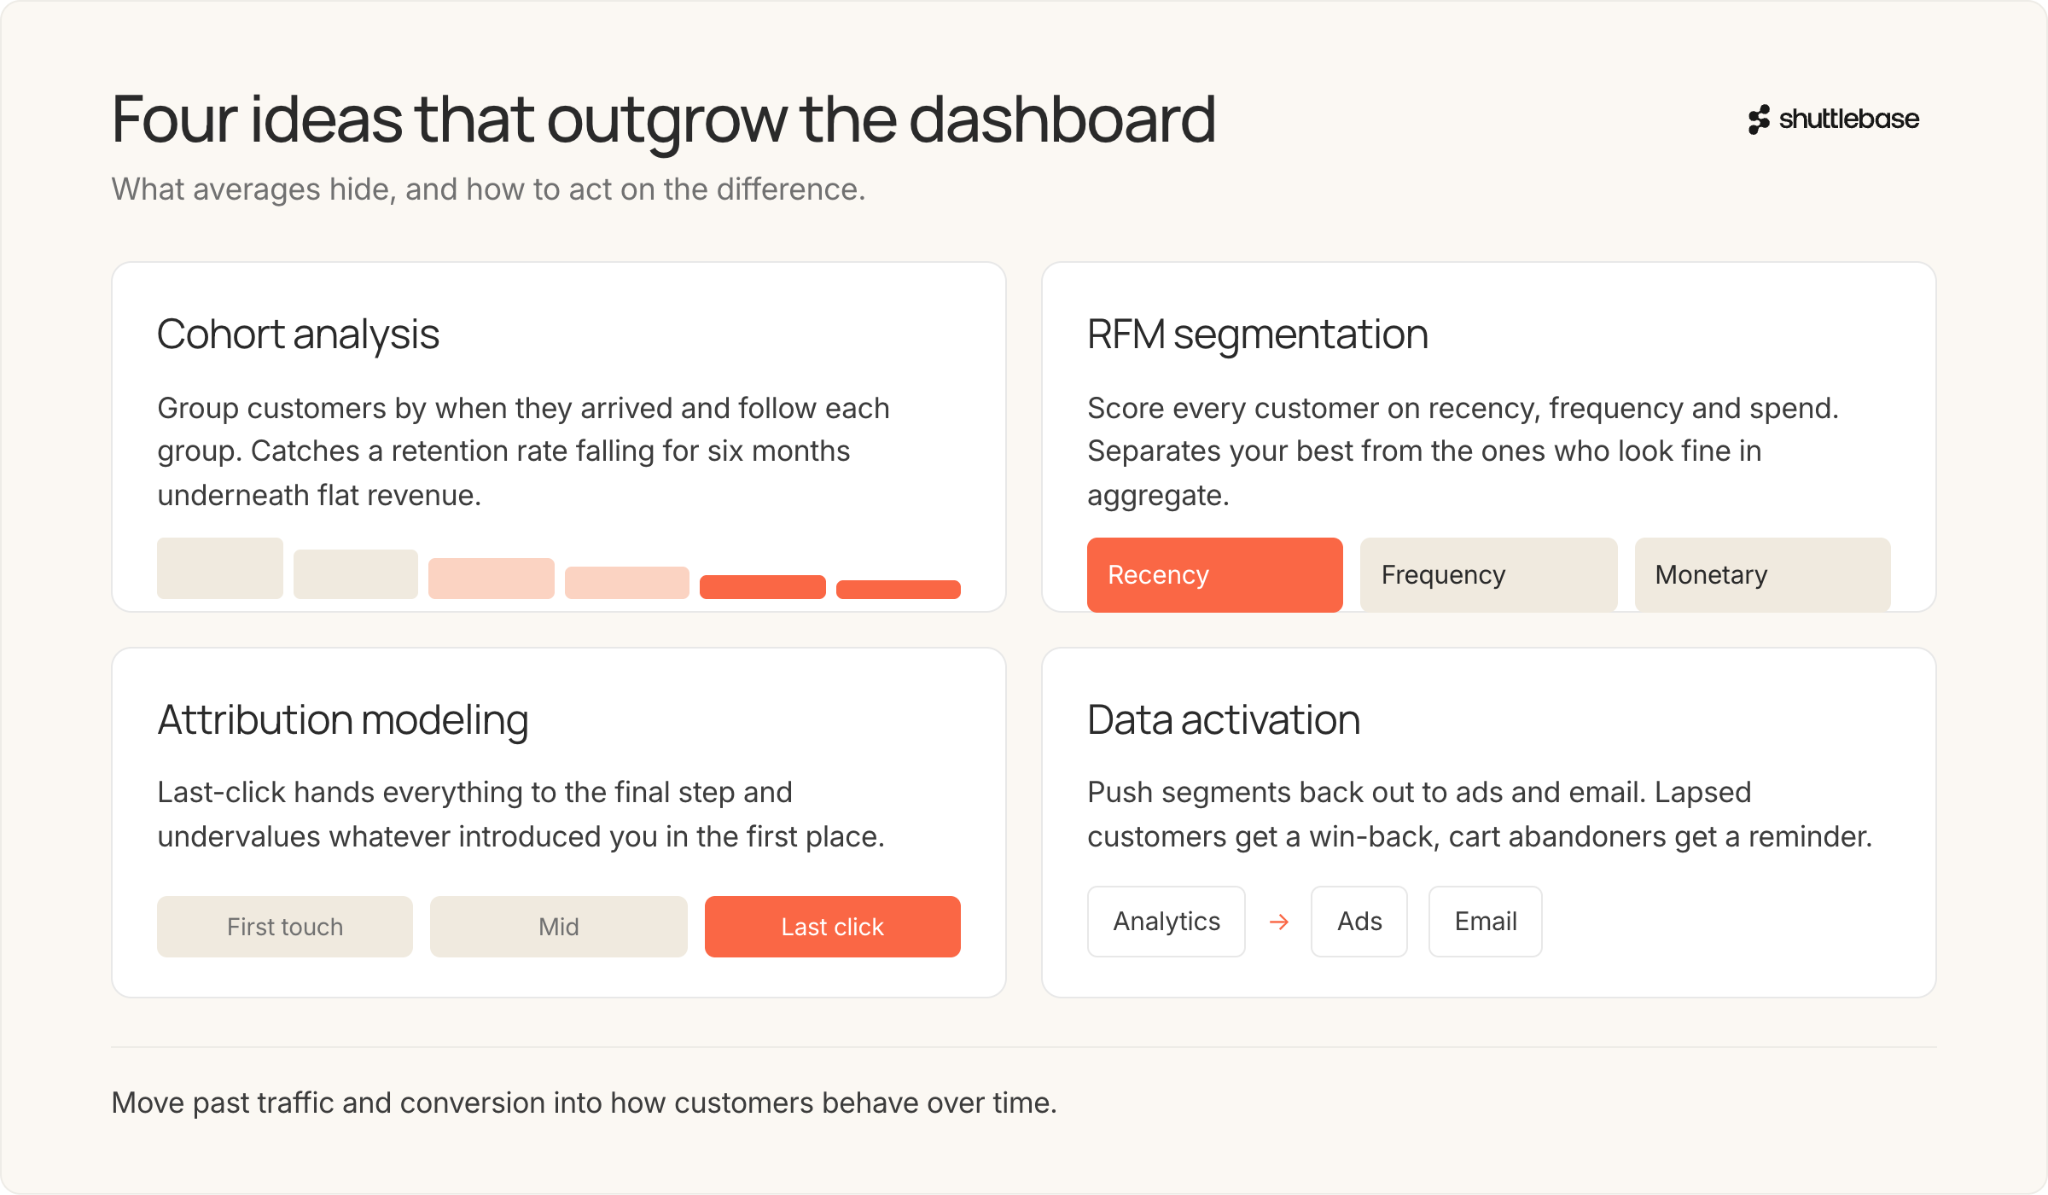
Once you're comfortable with the basics, these concepts help you move beyond traffic and conversion numbers into understanding how customers behave over time and which marketing efforts are actually working.
Cohort analysis groups customers by when they arrived (everyone who first bought in March, for instance) and tracks each group over time. It catches what averages hide, like a retention rate that's been falling for six months under flat overall revenue.
RFM segmentation scores every customer on how recently they bought, how often they buy, and how much they spend. It separates your best customers from the ones who look fine in aggregate but haven't come back since spring.
Attribution modeling decides which touchpoint gets credit for a sale. The default, last-click, hands everything to the final step and undervalues whatever introduced you to that customer in the first place. Because of this, companies regularly talk themselves out of the channel that was actually working.
Data activation closes the loop by pushing segments out of your analytics and into your ad platform or email tool. Lapsed customers get a win-back message. Cart abandoners get a reminder. First-time buyers get free shipping, and repeat buyers get the accessory that pairs with what they already own.
Make reviewing your analytics a habit
Analytics are useful only when you actually look at them. Here's how to start.
Name your goal, then pick two or three metrics. Acquisition, retention, or order size: choose which one you want to improve most this quarter. Each goal gets two or three numbers to watch. Twelve metrics is not more rigorous than three. It's a way to avoid deciding which one matters.
Audit what you're already collecting. Most sites carry tracking installed years ago by someone who has since left. Run Google Tag Assistant, place a real test order, and confirm the data lands where you expect it to. Untrustworthy data is worse than no data at all.
Track everything you care about. Put UTM tags on every link you control. Those are the small ?utm_source= additions that tell analytics which campaign drove a click. Without them, a big chunk of your traffic shows up as "direct" and your channel reporting becomes useless. While you're at it, filter out your own office traffic and your developers' visits.
You don't need personal data
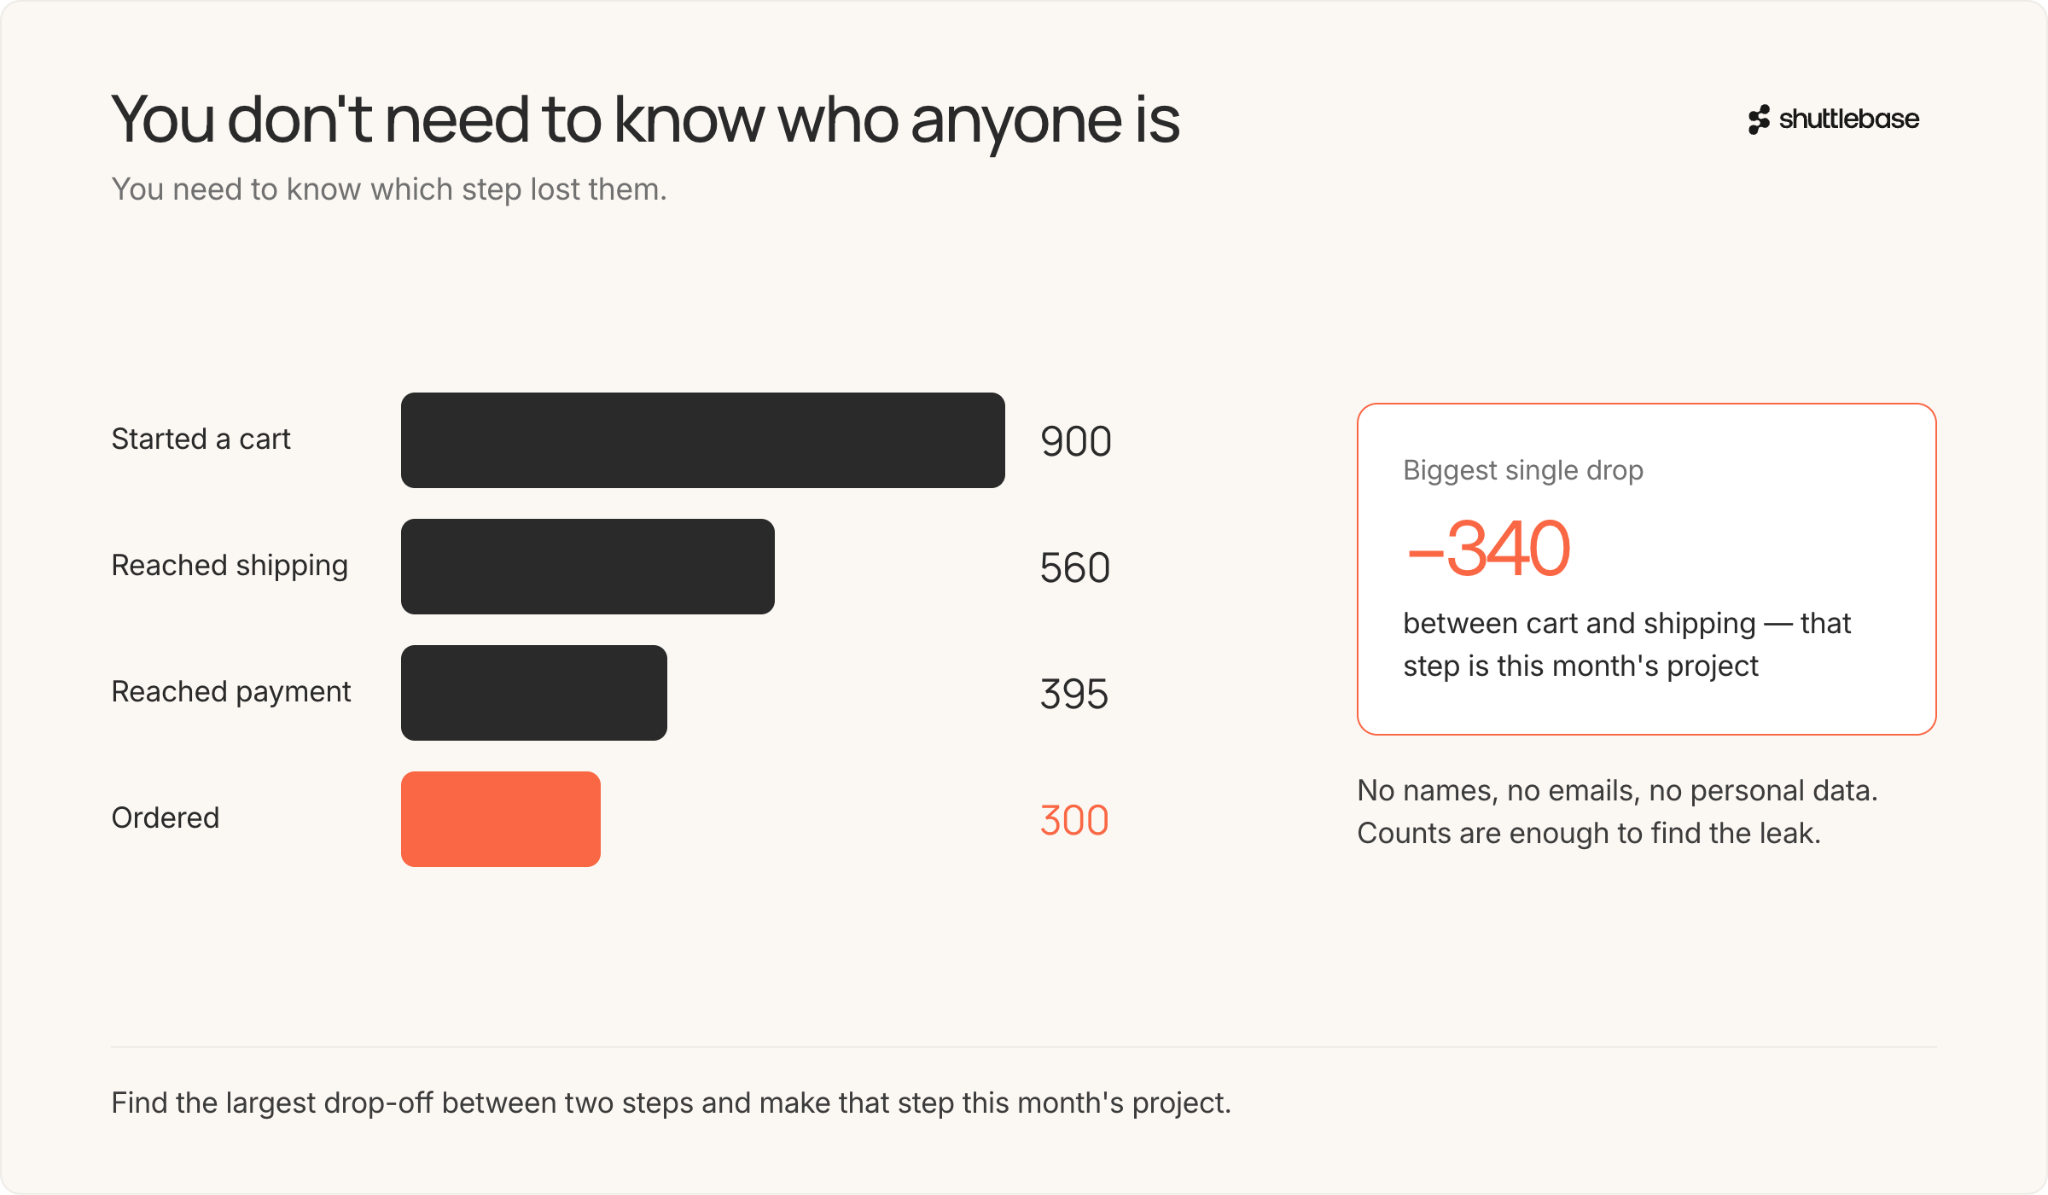
Almost every question worth asking can be answered by aggregate data. You don't need to know who anyone is. You need to know that 900 people started a cart, 600 didn't finish, and which step lost them.
Since you don't need personally identifying information, don't collect it. GDPR covers anyone with European visitors, CCPA covers California, and ePrivacy governs cookies specifically. Between them, they require consent before non-essential tracking, a way to opt out, disclosure of what you collect and why, and limits on retention. What applies to you depends on where you and your customers are. When in doubt, talk to someone qualified.
Third-party cookies are going away regardless of anyone's feelings about privacy, and consent banners already bias what you see. People who decline tracking tend to be earlier in the funnel, which can make your discovery channels look worse than they are. First-party data is what keeps working. Building on it pays off today and keeps paying off for years.
Common questions
How much traffic do I need before analytics matter? Any at all. A broken checkout shows up at fifty visits. Comparing two versions of a page reliably takes a few thousand visits a month.
What should I spend on tools? Nothing, until the free ones stop answering your questions. Pay when the hours you spend exporting and rebuilding reports cost more than the license.
How do I track across channels? UTM tags on every link you control, one tool designated as the source of truth, and the discipline to stop trying to reconcile two tools that will always disagree by a few percent.
Do I need to hire an analyst? When you're reliably generating good questions and reliably too busy to answer them. Not before. A fractional consultant a few days a month covers the gap for a long time.
What's the difference between web analytics and ecommerce analytics? Web analytics tells you about visits and pages. Ecommerce analytics adds what those visits were worth: orders, revenue, products, and the path to purchase. Most tools do both now. You usually just have to turn on the second part.
Pick one number and start
You don't need a data team or a new platform. Open your funnel report, find the largest drop-off between two steps, and make that one step your project this month. Then do it again next month. Give yourself some structure and time to figure out what your data is telling you.
Knowing where visitors leave is the beginning. Next, figure out which changes are most likely to move the needle, then make them.
.jpg)
.jpg)
.jpg)