.jpg)
Share this article:
Why random chance is the problem
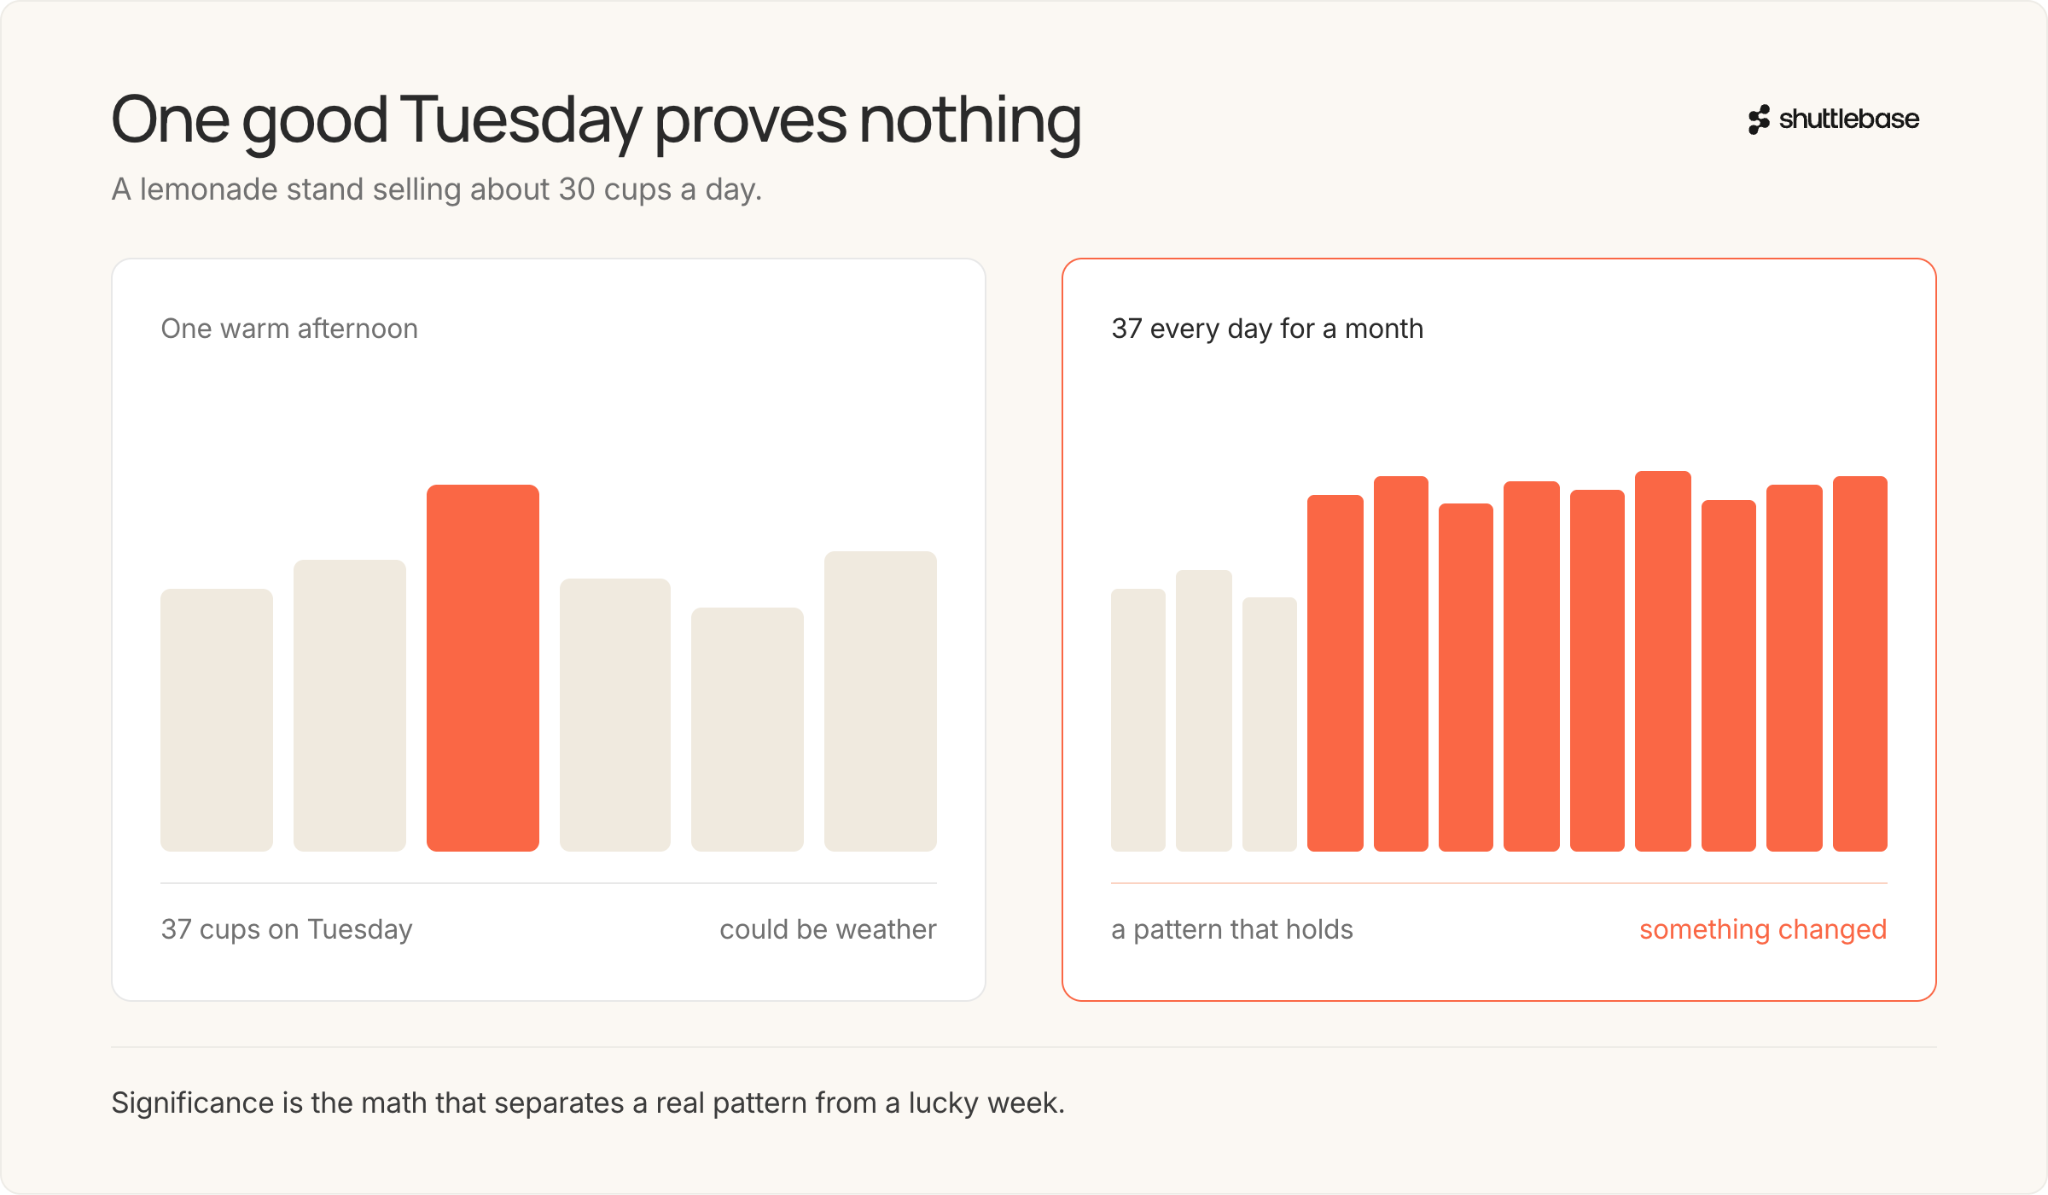
Say you run a lemonade stand and sell about 30 cups a day. One Tuesday you sell 37. Did something change, or was it just a warm afternoon? If you sell 37 every day for a month straight, something probably changed. But one good Tuesday on its own doesn't tell you much. Your website traffic works the same way. Some days more people buy, some days fewer, and none of it necessarily has anything to do with the change you're testing. Statistical significance is the math that separates a real pattern from a lucky week. Without it, you're treating noise like signal.
What a p-value tells you
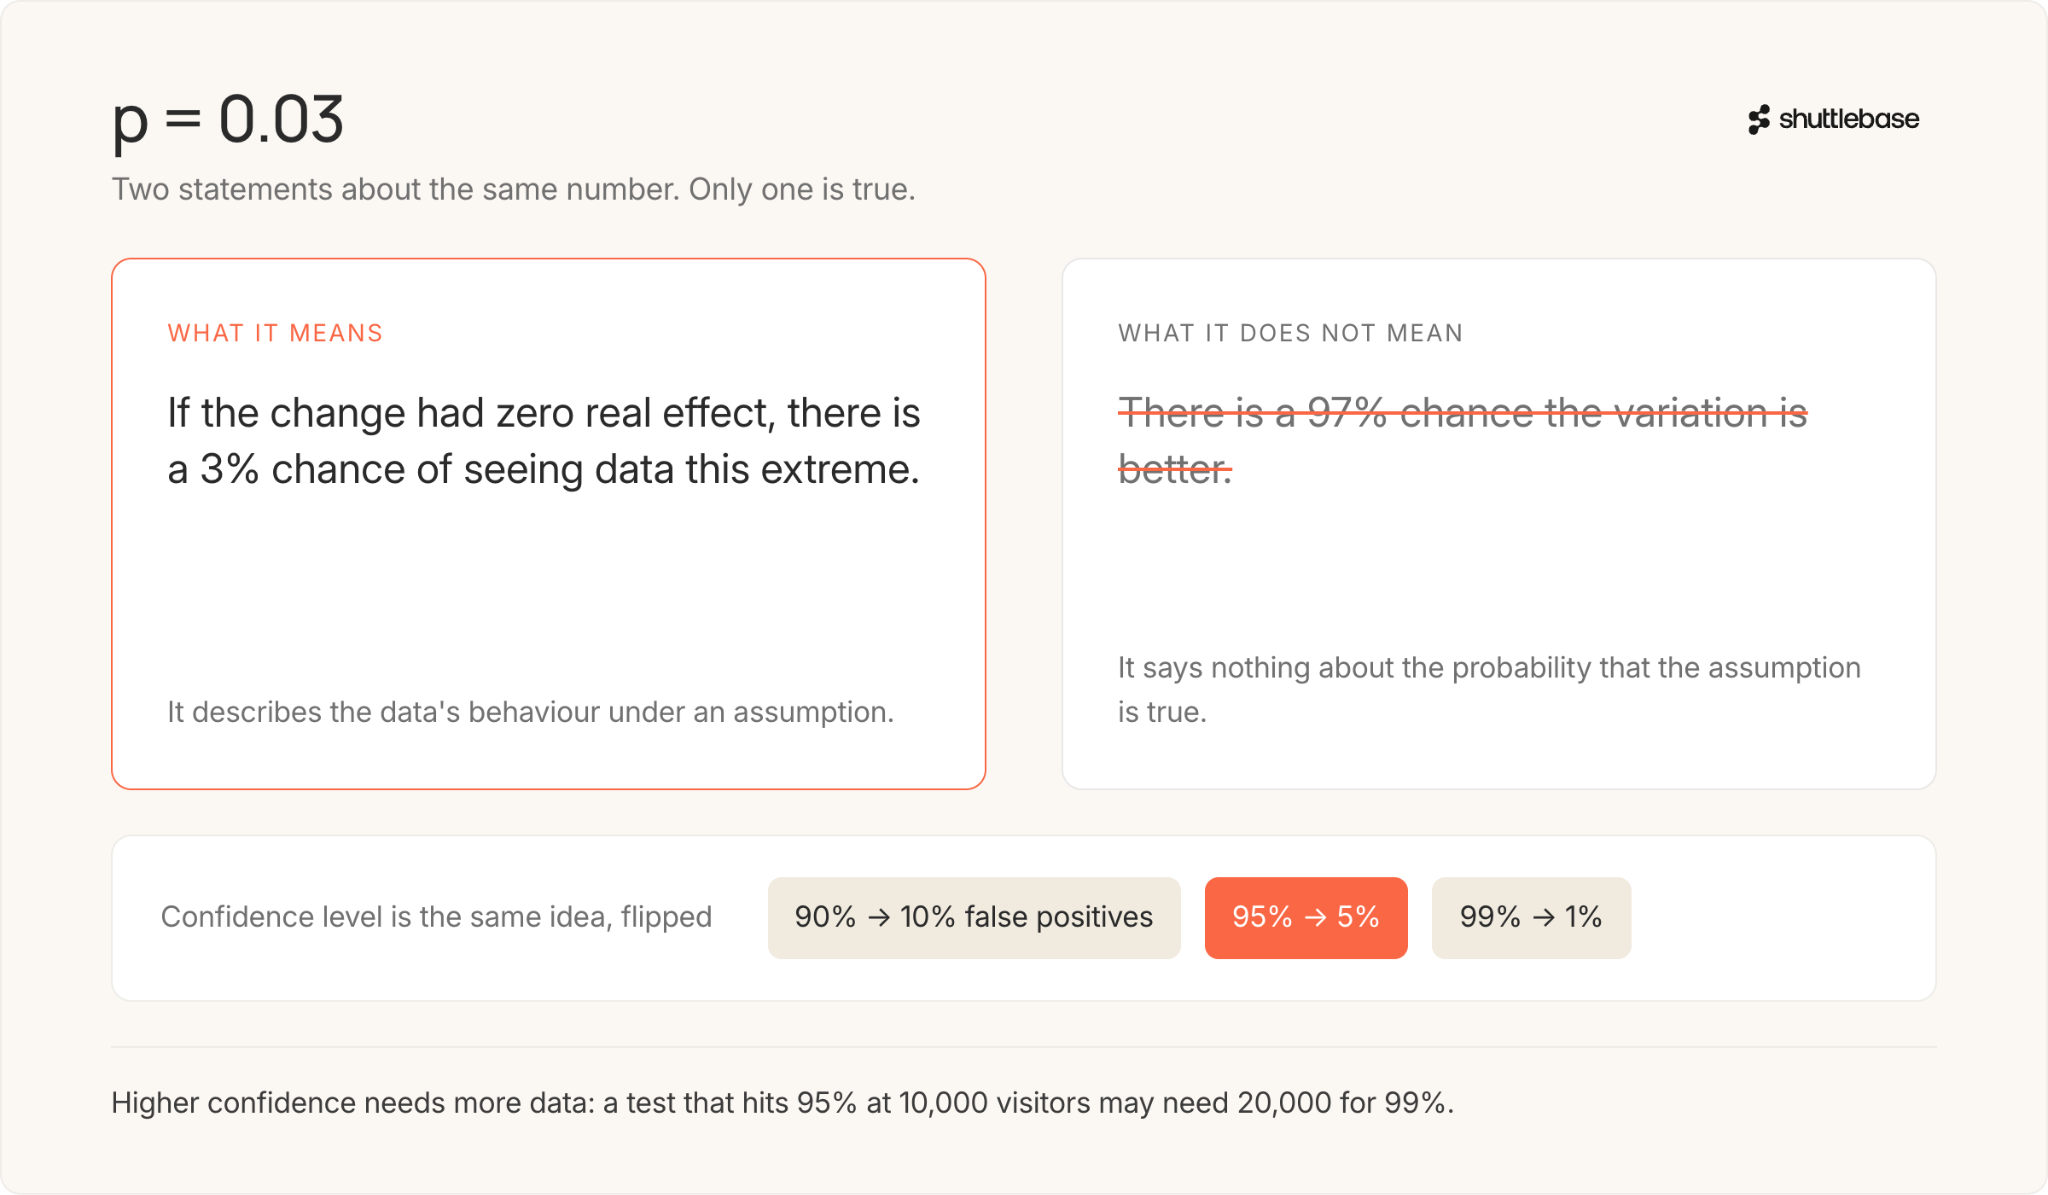
The p-value is the number behind statistical significance. It answers a specific question: "If there were truly no difference between these two versions, how likely would I be to see data this extreme?" A p-value of 0.03 means there's a 3% chance you'd see results this strong if the change had zero real effect. When the p-value drops below your threshold (usually 0.05), you call the result statistically significant. Here's what a p-value does not tell you: it does not tell you the probability that your variation is better. That's a common misread, and it matters. The p-value describes the data's behavior under an assumption. It does not describe the probability that the assumption is true.
Confidence level is the same idea, flipped
When someone says a result has "95% confidence," they mean the p-value is below 0.05. The two numbers are just two ways of saying the same thing. A 95% confidence level means a 5% false positive rate. A 99% confidence level means a 1% false positive rate. Higher confidence sounds better, but it comes with a cost: you need more data to reach it. A test that reaches 95% significance with 10,000 visitors might need 20,000 or more to reach 99%. For most A/B tests in ecommerce, 95% is the standard. Medical trials and safety-critical decisions often use 99% or higher.
Sample size: why it matters so much
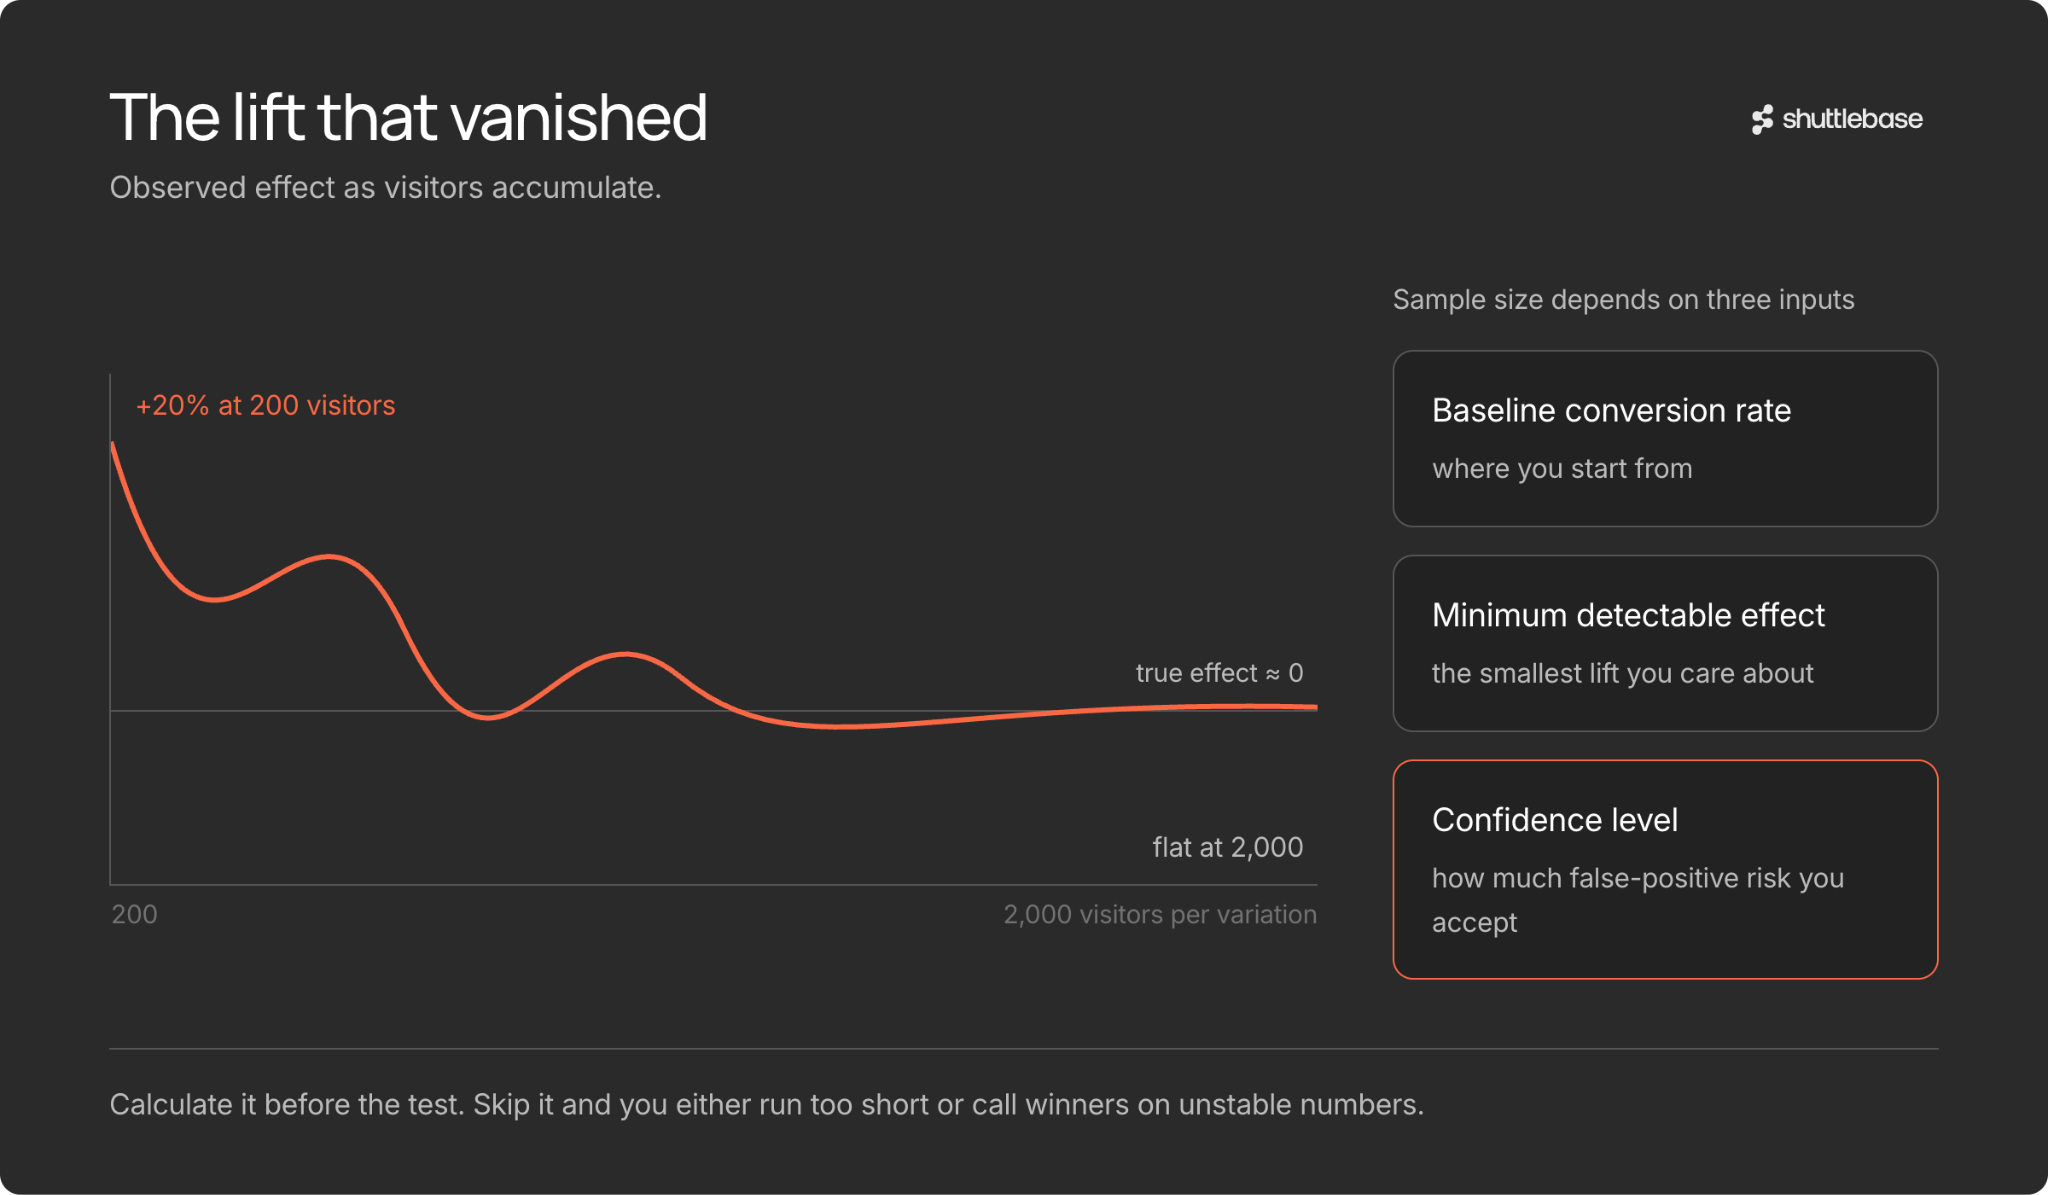
Statistical significance depends heavily on how much data you have. A test with 200 visitors per variation can easily show a 20% lift that vanishes entirely once you reach 2,000 visitors. That early "lift" was just randomness that hadn't been averaged out yet. Before running a test, you should calculate the sample size you need. That calculation depends on the baseline conversion rate, the smallest improvement you care about detecting (called the minimum detectable effect), and the confidence level you want. Skip this step and you'll either run tests that are too short to detect real differences, or call winners based on numbers that haven't stabilized yet.
Statistical power: the other error
Most people focus on false positives, where you declare a winner that isn't real. But there's a second kind of mistake called false negatives, where a real improvement exists but your test fails to detect it. Statistical power is the probability that your test will catch a real effect when one is there. The standard target is 80%, meaning you have a 20% chance of missing a real winner. Power depends on sample size, effect size, and your significance threshold. Crank the confidence level up to 99% and your power drops unless you add more visitors. The two errors pull in opposite directions. Tightening one loosens the other unless you increase sample size.
The peeking problem
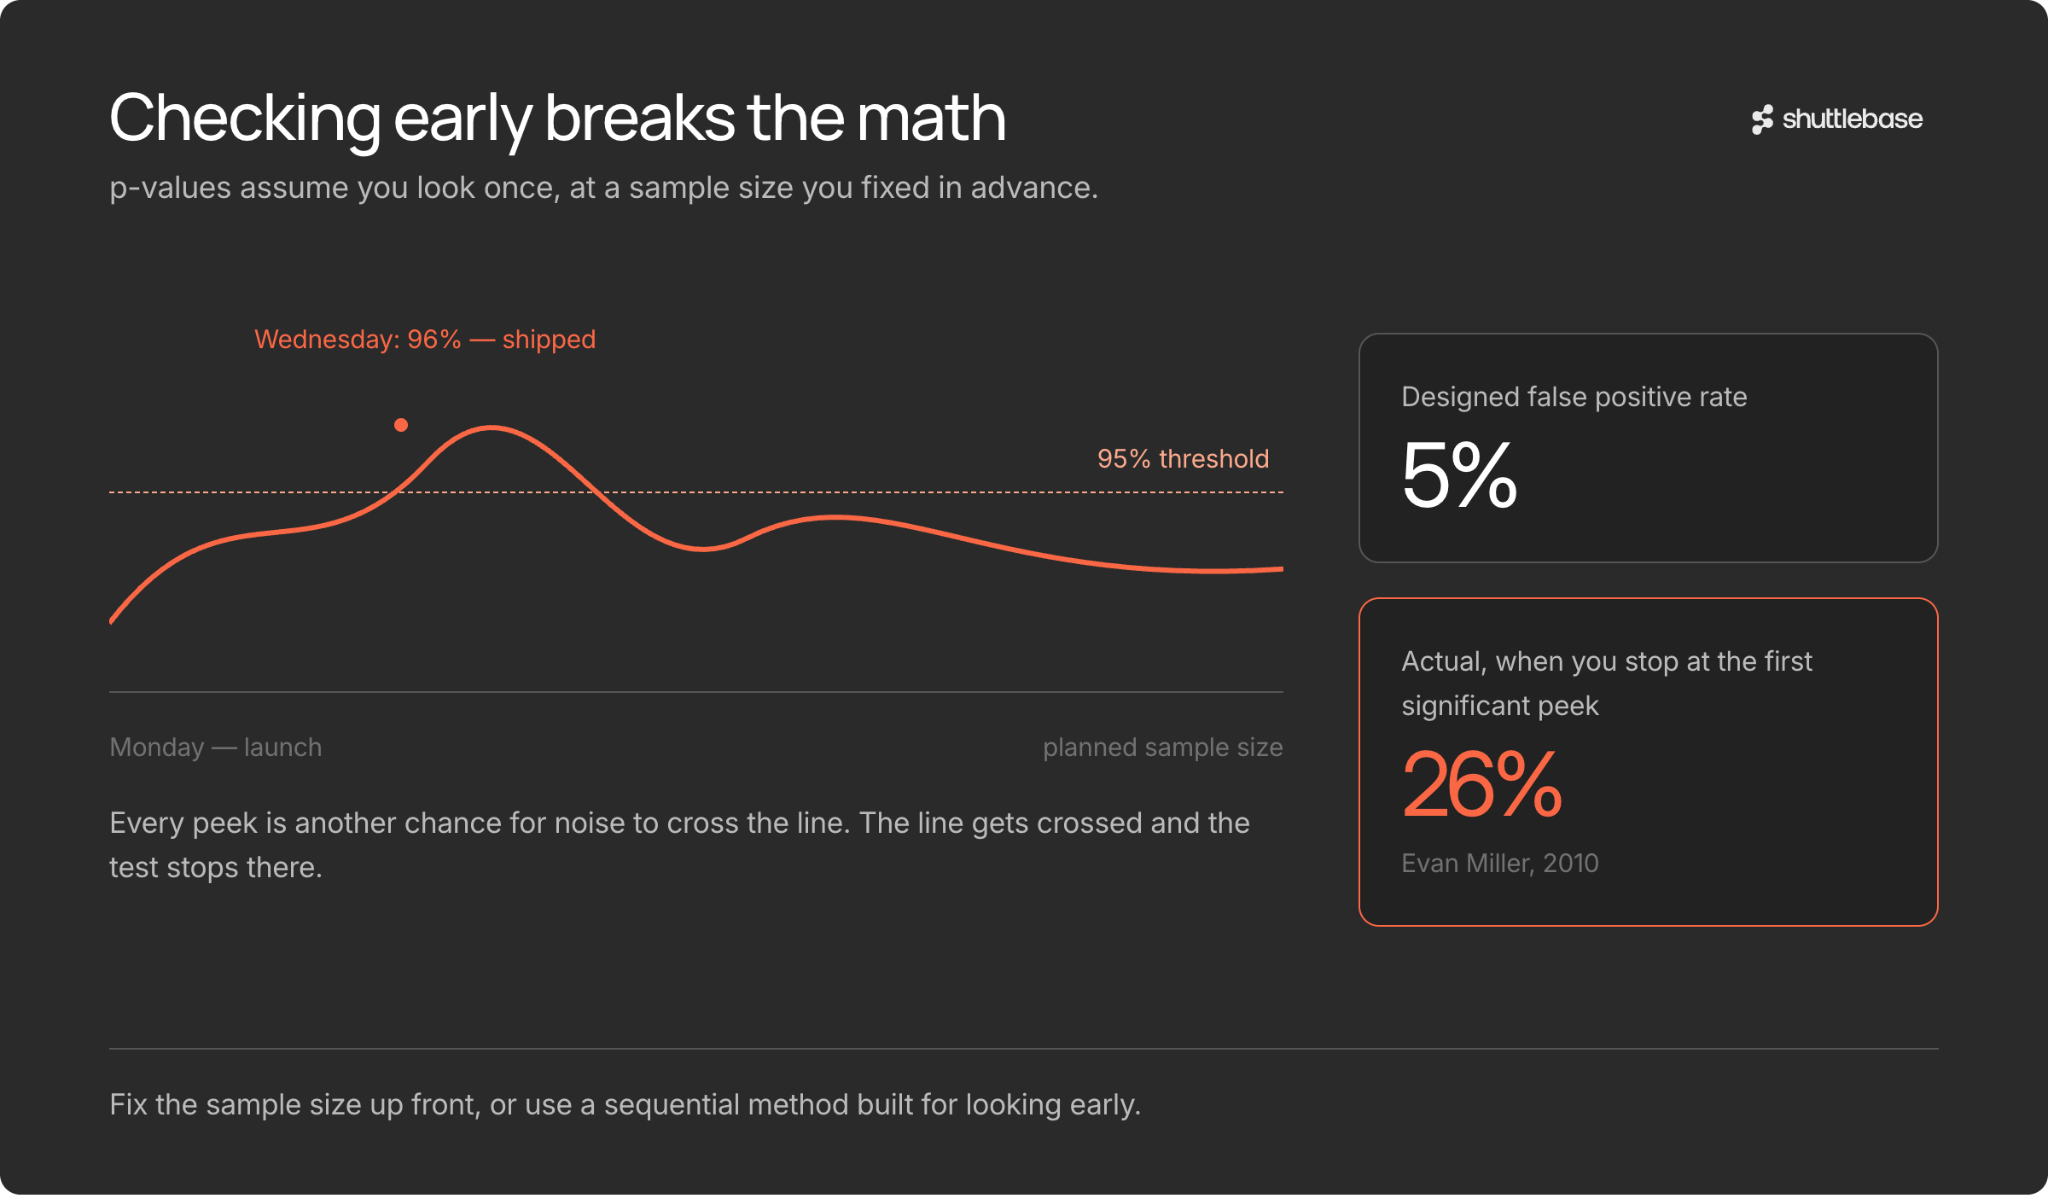
This is where most A/B tests go wrong in practice. You launch a test on Monday and by Wednesday, the dashboard shows 96% significance. You call it a winner and ship it. The problem is the p-values assume you look at the results exactly once, at a predetermined sample size. Every time you peek early and consider stopping, you increase the odds of a false positive. Decide your sample size before you start, and don't call the test until you reach it. If you need to check early, use sequential testing methods designed for that purpose.
Confidence intervals tell you more than pass/fail
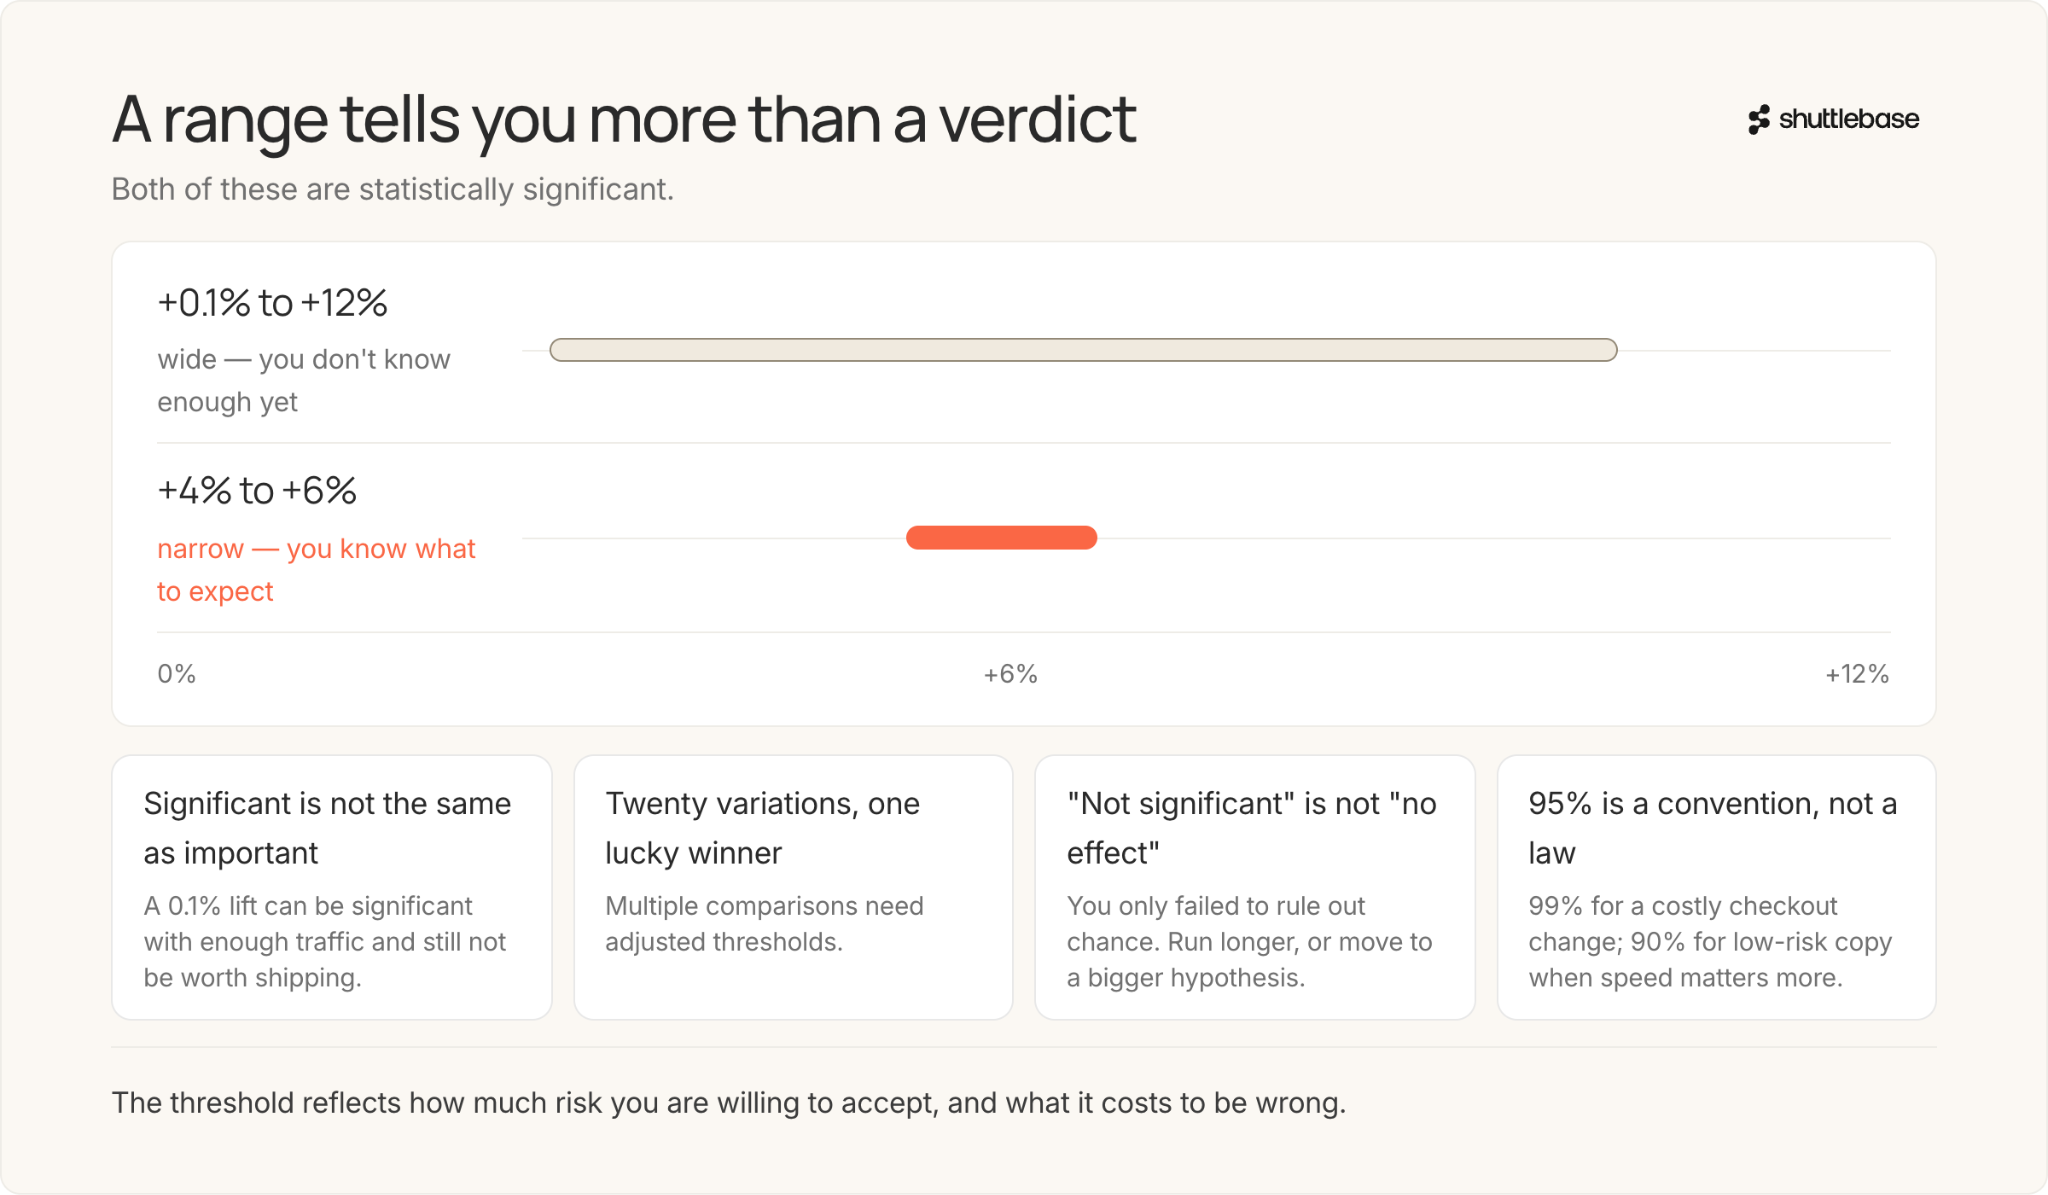
A p-value gives you a yes-or-no answer. Confidence intervals give you a range. A 95% confidence interval of +2% to +8% means: if you ran this test many times, 95% of those intervals would contain the true effect. The interval tells you not just whether the effect is real, but how big it might plausibly be. A confidence interval of +0.1% to +12% is technically significant but tells you the effect could be almost nothing or quite large. You don't know enough yet. A confidence interval of +4% to +6% is significant and precise. You know roughly what to expect. Width matters. Narrow intervals mean you have enough data to be specific. Wide intervals mean you have a result but not much certainty about its size.
Common mistakes
Calling a test too early. A result that's significant at 500 visitors may not be at 5,000. Early significance often reflects noise.
Confusing significance with importance. A 0.1% lift can be statistically significant with enough traffic. That doesn't make it worth implementing.
Running too many tests on the same data. Test 20 variations and one will hit p < 0.05 by chance alone. Multiple comparisons need adjusted thresholds.
Ignoring the losing tests. A test that doesn't reach significance isn't proof the change doesn't work. It might mean you didn't have enough traffic to detect the effect.
Misreading the p-value. "p = 0.04" does not mean "there is a 96% chance the variation is better." It means there's a 4% chance of seeing data this extreme if the variation had no real effect. Those are different statements.
What "not significant" means
A result that doesn't reach significance is not proof that nothing happened. It means you can't confidently rule out chance. Maybe the variation does work, but the effect is small, and you needed more visitors to see it. Maybe it genuinely has no effect. You can't tell from a nonsignificant result alone. This is frustrating, but it's honest. Declaring "no effect" from a nonsignificant result is as dangerous as declaring a winner from a significant one too early. Both overstate what the data actually told you. If a test comes back inconclusive, the right move is usually to either run it longer with more traffic, or move on to a higher-impact hypothesis.
When to use a different threshold
The 95% threshold is a convention, not a commandment. You can adjust it for good reasons. If a wrong decision is expensive (you're changing your checkout flow and a bad change costs real revenue), consider 99%. If you're running a low-risk test on a small piece of copy and you'd rather move fast, 90% might be reasonable. The threshold reflects how much risk you're willing to accept. Lower confidence means more speed but more false positives. Higher confidence means fewer mistakes but slower testing cycles. The right answer depends on what you're testing, how much traffic you have, and what it costs to be wrong.
.jpg)
.jpg)