Share this article:
Conversion rate optimization, or CRO, is the practice of increasing the percentage of visitors who complete a specific action on your site. This could be anything from completing a purchase to adding an item to the cart or signing up for an email newsletter.
CRO is not a one-time project or a checklist you work through and walk away from. And it certainly is not buying more traffic to patch a weak funnel. Real growth comes from getting more value from the visitors you already have and using evidence to decide what changes to test on your site to drive real impact.
The Different Types of Conversions and How Conversion Rate is Calculated
Some conversions represent success, while others indicate that a visitor is heading in the right direction, and knowing which is which helps you understand how people move through your site and where opportunities for improvement exist.
Macro vs Micro Conversions
A macro conversion is the main goal of your site, the final step you want a visitor to take. For ecommerce, a typical conversion would be a completed purchase. If you run a SaaS site, it could be signing up for a subscription.
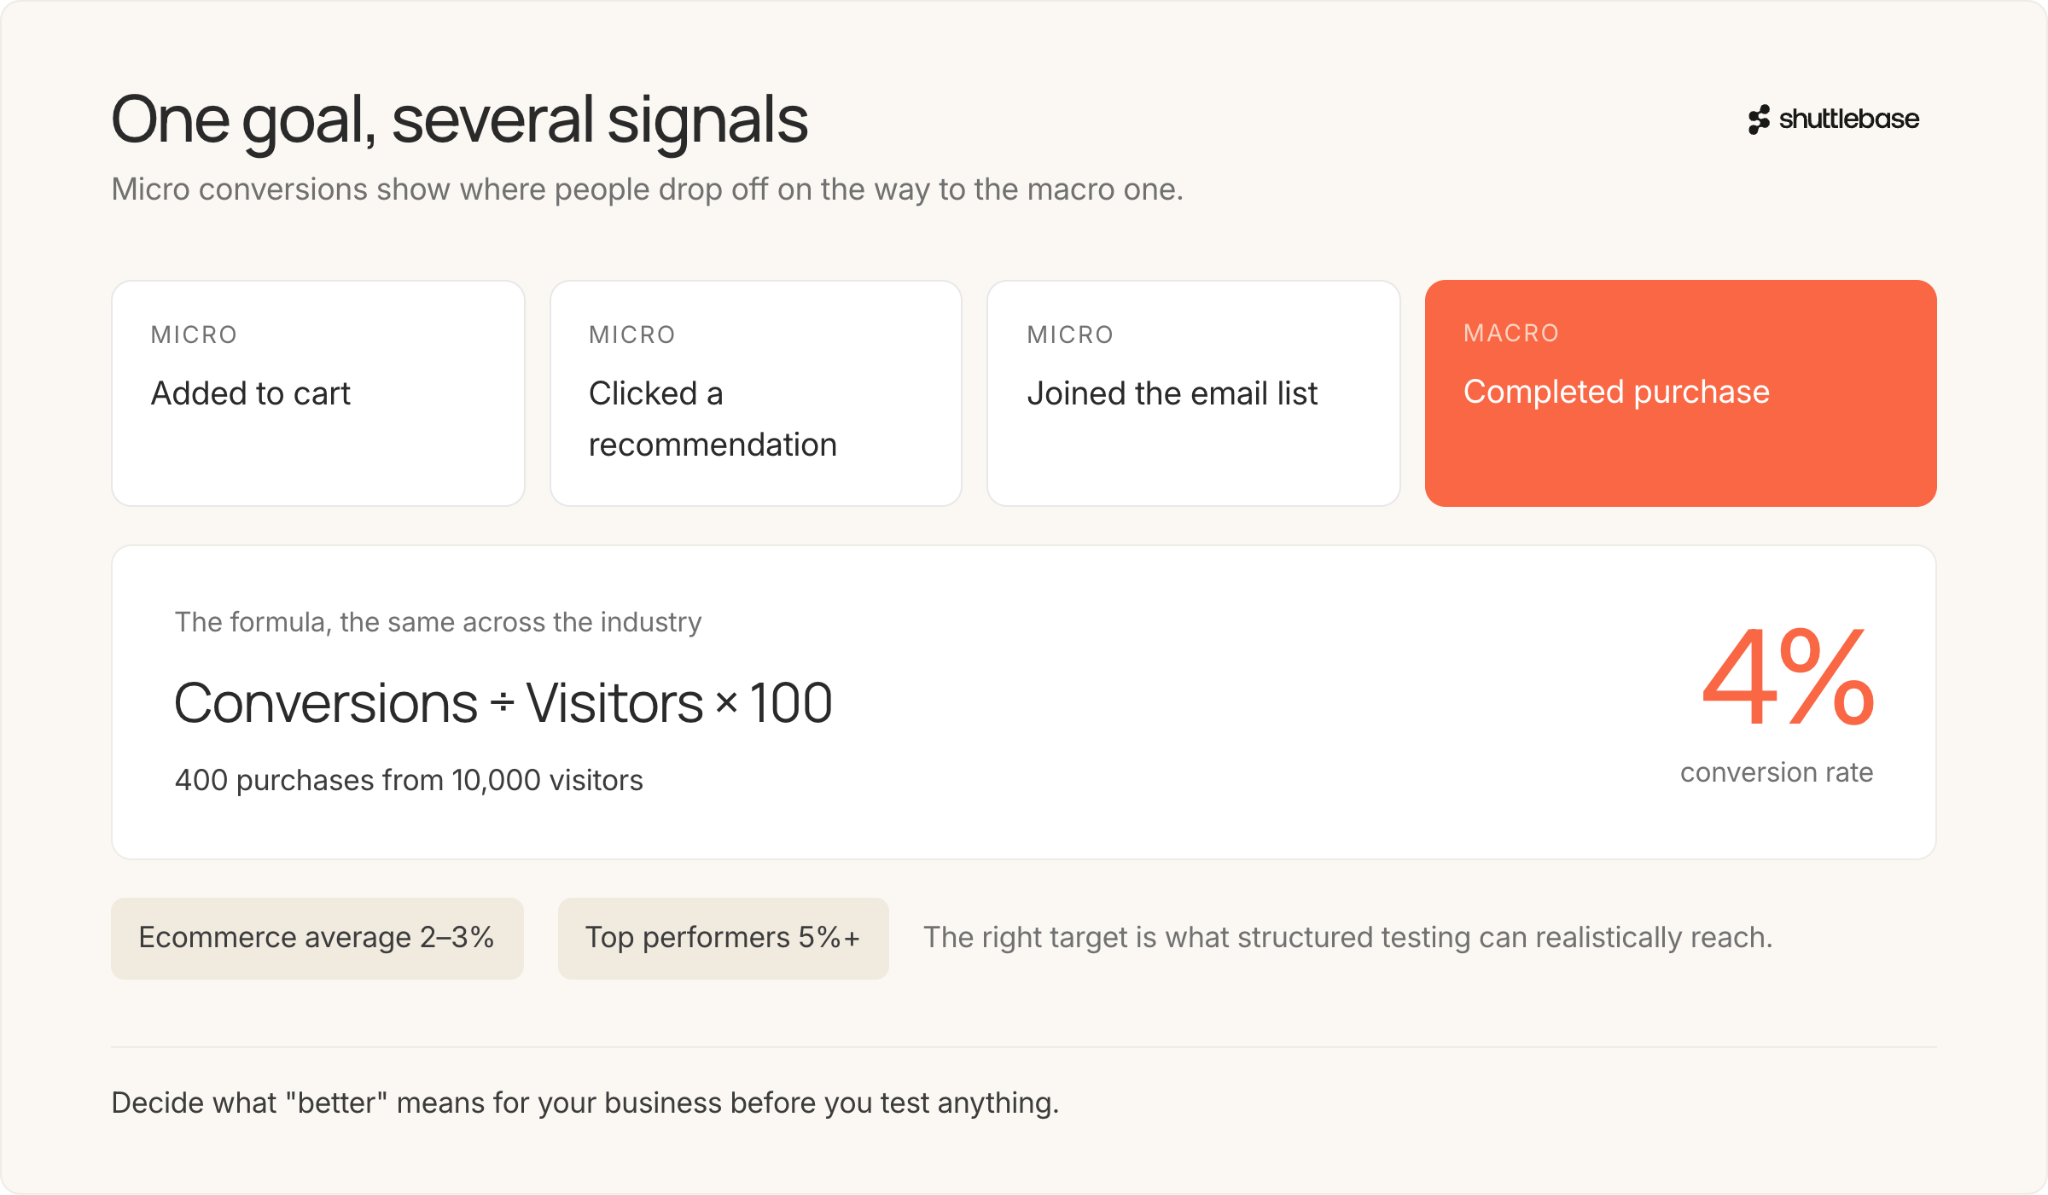
Micro conversions are smaller steps along the way, like adding a product to a cart, clicking a product recommendation, or signing up for your email list. Optimizing for the macro conversion matters most, but micro conversions are useful to analyze because they show where people drop off in the process.
The Conversion Rate Formula
Here is how to calculate conversion rate, the same way across the industry:
Conversion Rate = (Number of conversions ÷ Number of visitors) × 100
If 400 out of 10,000 visitors make a purchase, your conversion rate is 4 percent.
What is a “Good” Conversion Rate?
Widely reported benchmarks put the ecommerce average conversion rate around 2 to 3 percent, but this number varies depending on the industry you’re in. Top-performing sites reach 5 percent or higher, but many stores sit below that range. The right target is what you can realistically reach with structured testing, measured against revenue and customer lifetime value.
Before testing, decide what “better” means for your specific business. Are you looking to close more sales overall, increase order size, or both? Clear goals let you design the right experiments and measure the real impact.
Why CRO Matters: The Revenue Hiding in Traffic You Already Have
Everyone knows driving traffic to your site costs money, whether you're paying directly through ads and influencer partnerships or investing time and resources in content marketing and SEO. Every visitor has an acquisition cost, so converting as many as possible is essential to maximizing your return.
Conversion rate optimization captures value from the visitors you already have, making every marketing dollar count and lowering the effective cost to acquire a customer. In our experience working with ecommerce clients, teams that run continual tests across the funnel see revenue-per-visitor lifts of up to 180 percent.
These sources of value - missed clicks, unnecessary friction, poorly prioritized CTAs - are already sitting in your current traffic. Running more paid ads or chasing new visitor sources costs more and returns less over time. CRO compounds growth by getting more from the visitors you already have.
How CRO Works: The Optimization Loop
CRO is a repeatable process. It runs through the same four steps every time, whether you are testing a headline or a full layout.
- Find where you are losing visitors.
- Form a hypothesis about what would fix it.
- Test the change, side by side, with real traffic.
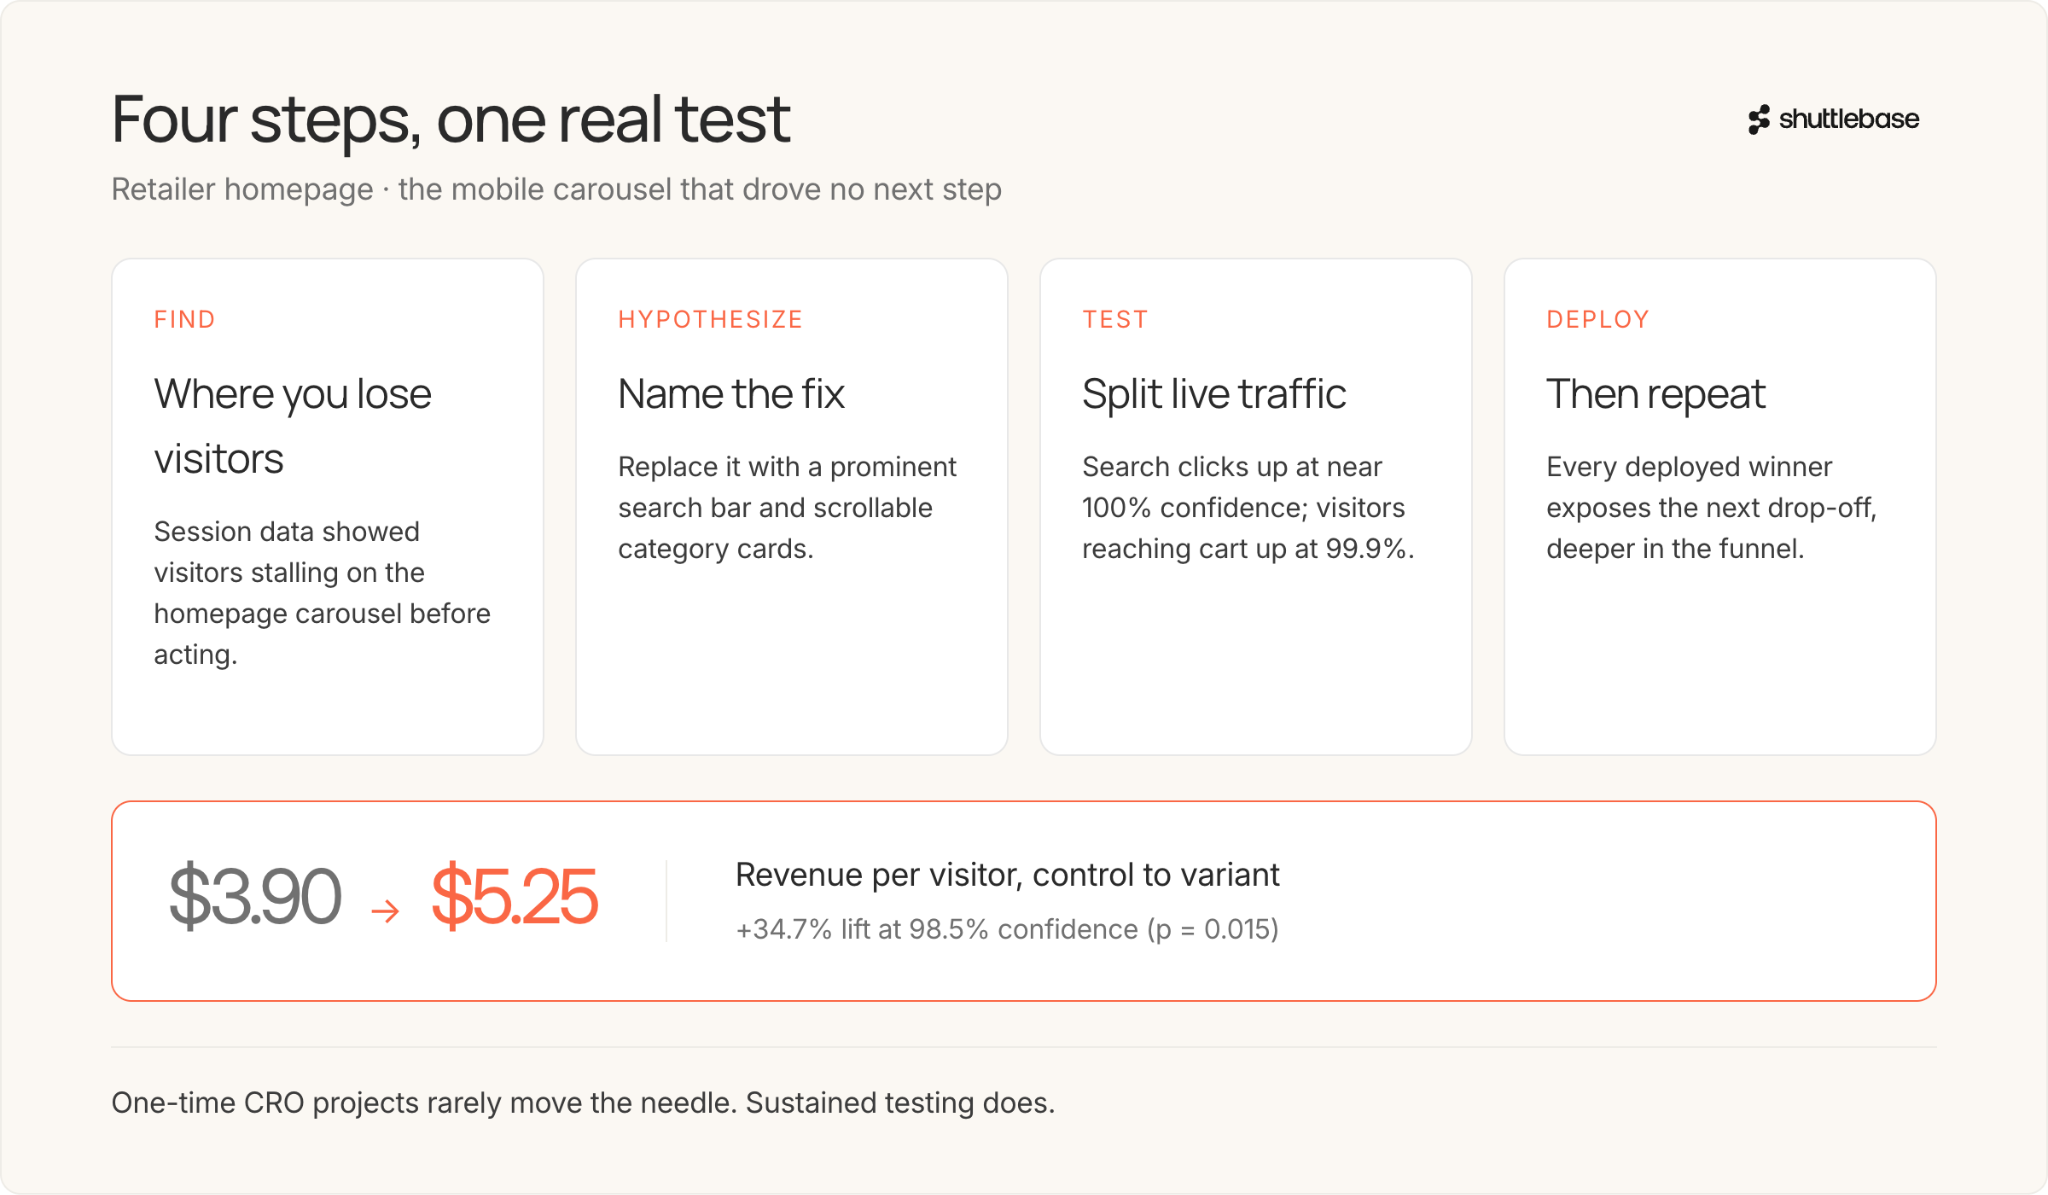
- Deploy the winner, then repeat.
Let’s walk through each step using a real retail customer example.
1. Find Where You're Losing Visitors
The first step is understanding the friction points on your website.
For this retailer, the analytics and session data showed that visitors were experiencing friction on the homepage. The mobile carousel took up prime real estate but didn't drive clear next steps, so visitors stalled or left the page before acting.
Other signals in this stage can include:
- High bounce rates on important pages.
- Low completion rates for add-to-cart or checkout.
- Clicks clustering away from your desired call to action.
- Feedback from users who tried and failed to find something.
A good CRO program begins with a mix of quantitative data (analytics, funnel analysis) and qualitative research (session replays, user surveys).
2. Form a Hypothesis
Once the data flags a drop-off, the next step is forming a testable hypothesis, a specific guess at what would fix the friction point.
In this example, the hypothesis was that visitors couldn't easily figure out what to do next. The homepage carousel promoted offers, but buried the primary action. Our AI proposed replacing it with a prominent search bar and scrollable category cards, making product discovery the focal point.
A clear hypothesis includes:
- A precise change (replace carousel with search-first layout).
- The intended effect (make it easier for users to start shopping).
- A measurable outcome (increase in revenue per visitor).
3. Test the Change (A/B Testing)
Next, you run the experiment. A/B testing splits your live visitors between two versions (or more depending on the test), the original (control) and the new variation (variant). Once enough data accumulates, you can tell whether the new version outperformed the old one. For the full method, see our guide to A/B testing.
The outcome: revenue per visitor on the control was $3.90. On the new design, it jumped to $5.25. That is a 34.7 percent lift, confirmed at 98.5 percent confidence (p-value: 0.015).
Supporting signals backed this up:
- Clicks on the search input field and search submit button rose, as measured by tracked event data with near-100 percent confidence.
- The share of visitors reaching the cart increased, with 99.9 percent confidence.
The test showed the new layout drove more action.
4. Deploy the Winner to Your Site, Then Repeat
Once the data says a version wins, roll it out to all users. This is when the change starts making real money.
But the loop doesn't stop after one test. Every time you deploy a winner, another drop-off can emerge, on the same page or deeper in the funnel. Continuous CRO is about running this loop across every part of your site that needs improvement.
One-time CRO projects rarely move the needle, but sustained, compounding testing does.
What Does and Doesn’t Move Conversion
When testing on your website, it’s easy to look for ideas through best practices if you don’t know where to start. But best practices are only hypotheses and starting points for testing. Across thousands of tests, what wins in one context often fails, or even backfires, in another.
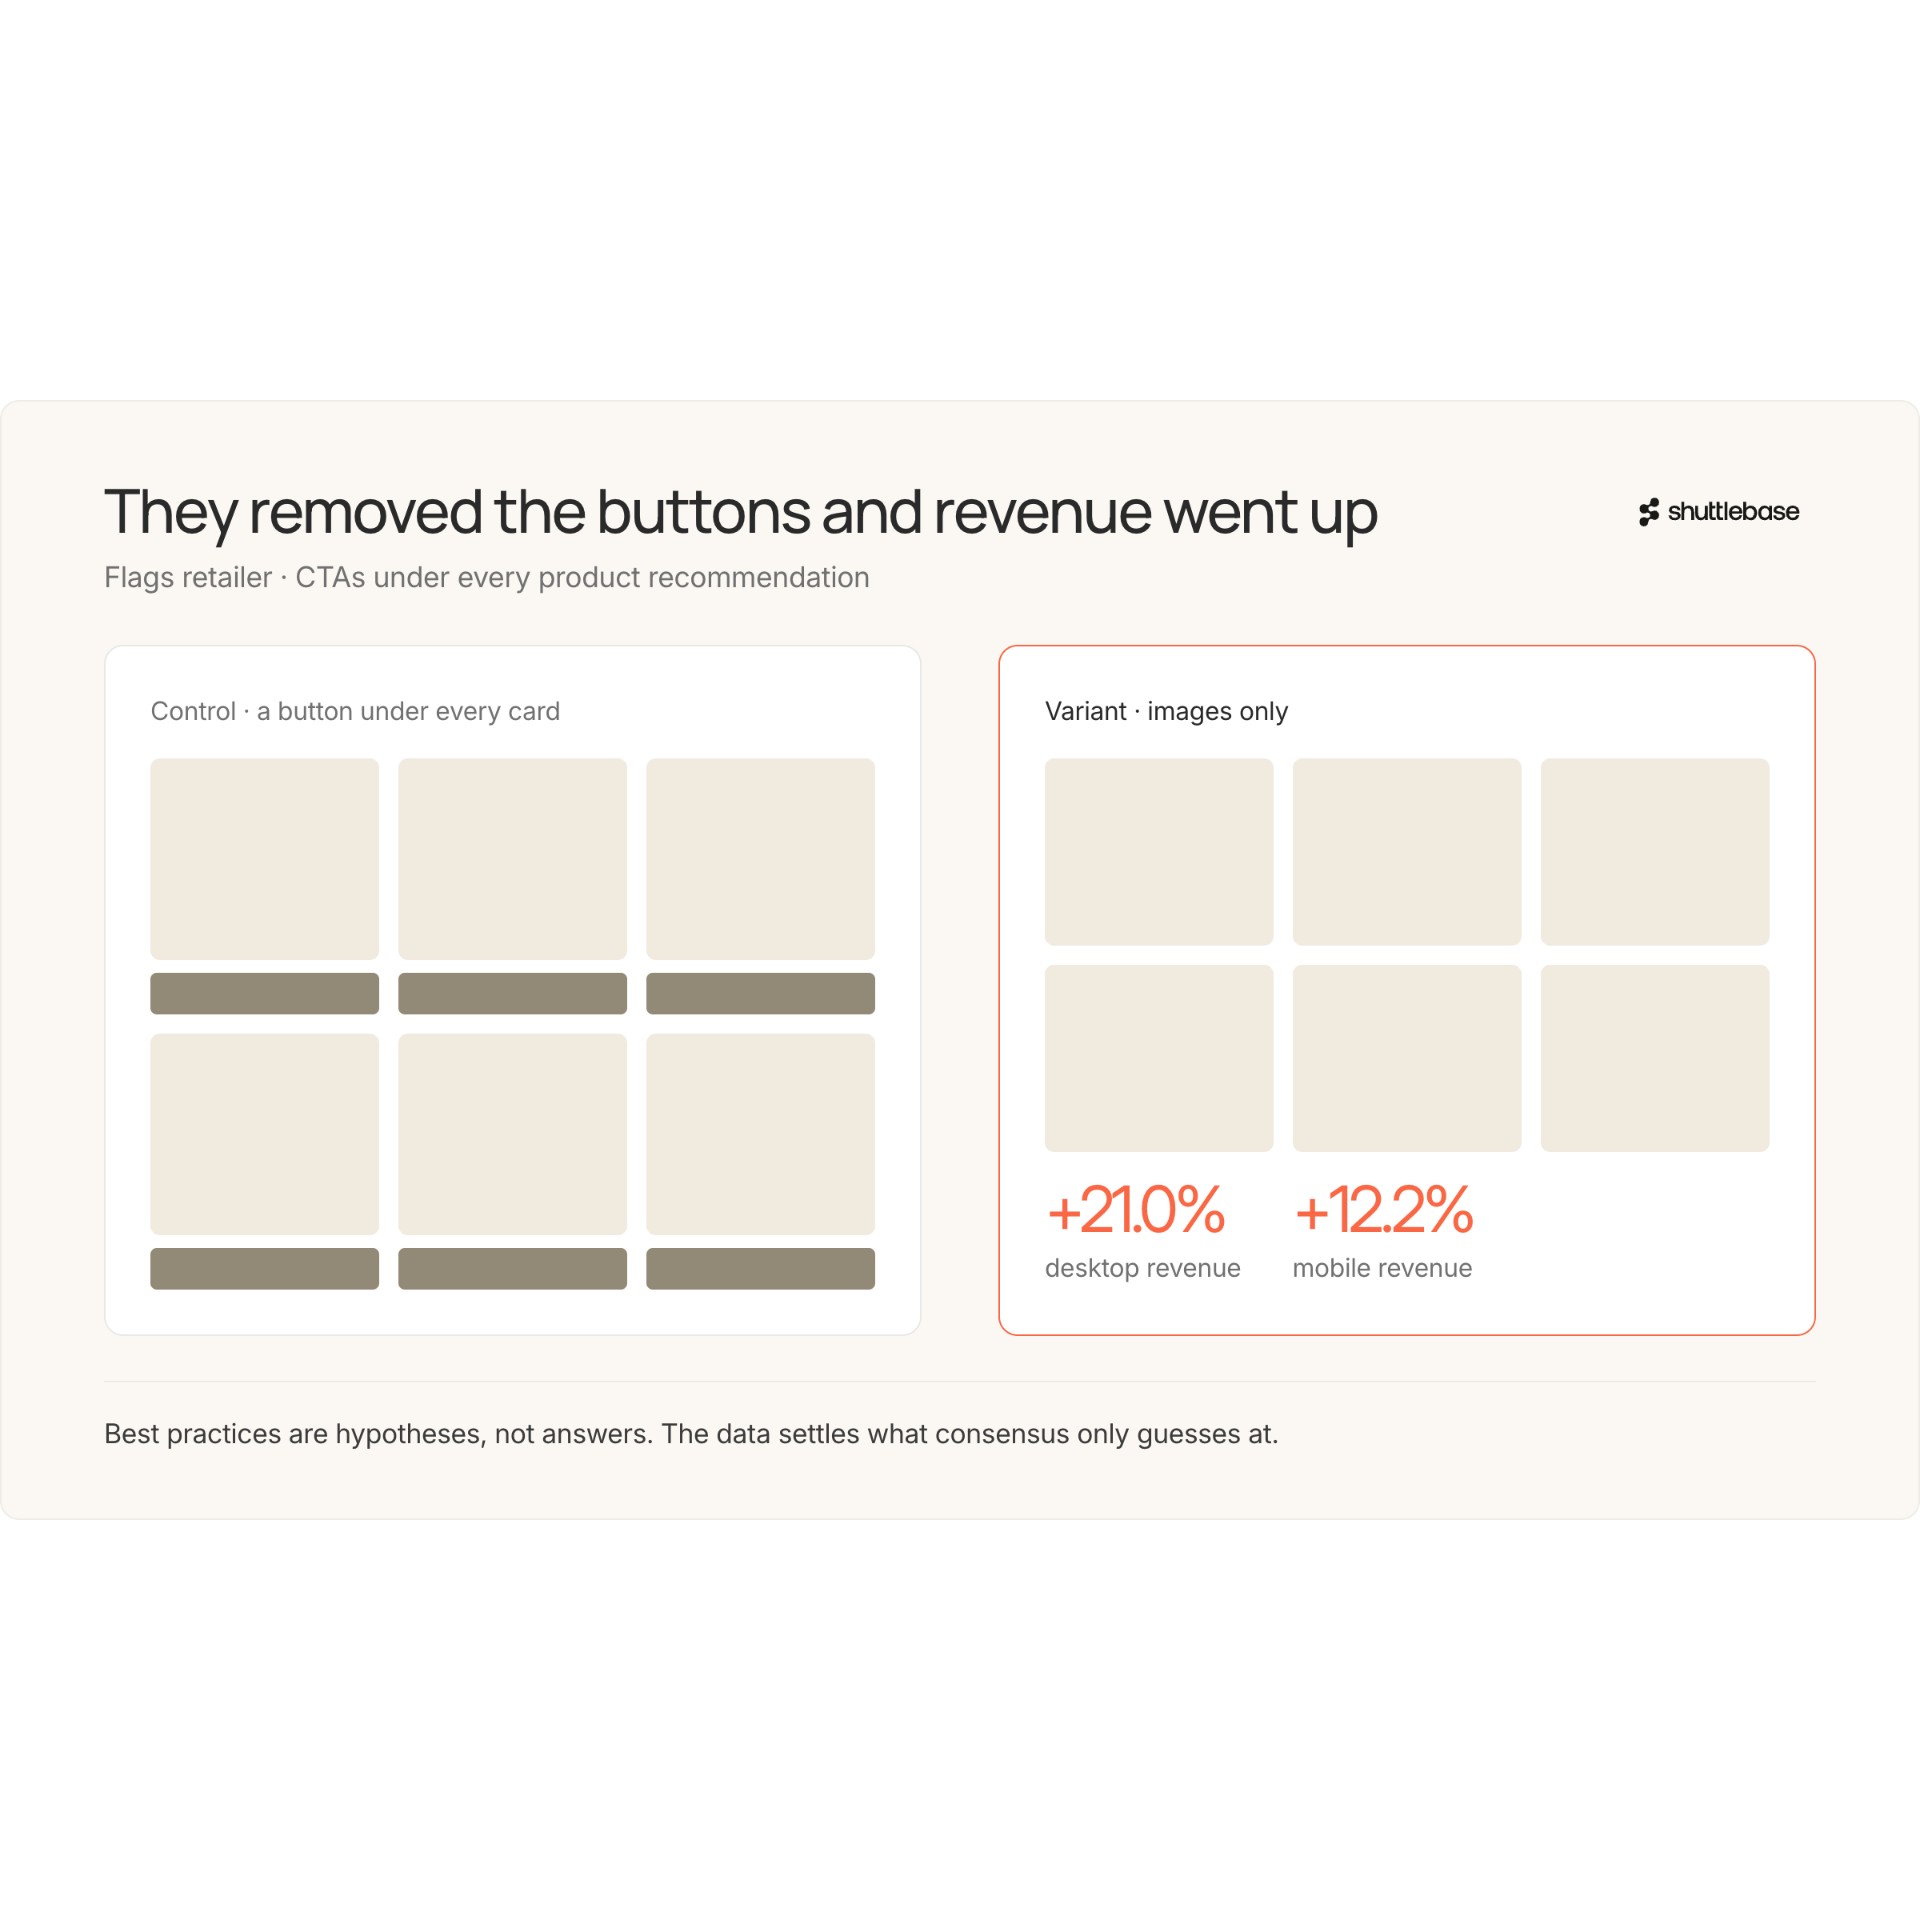
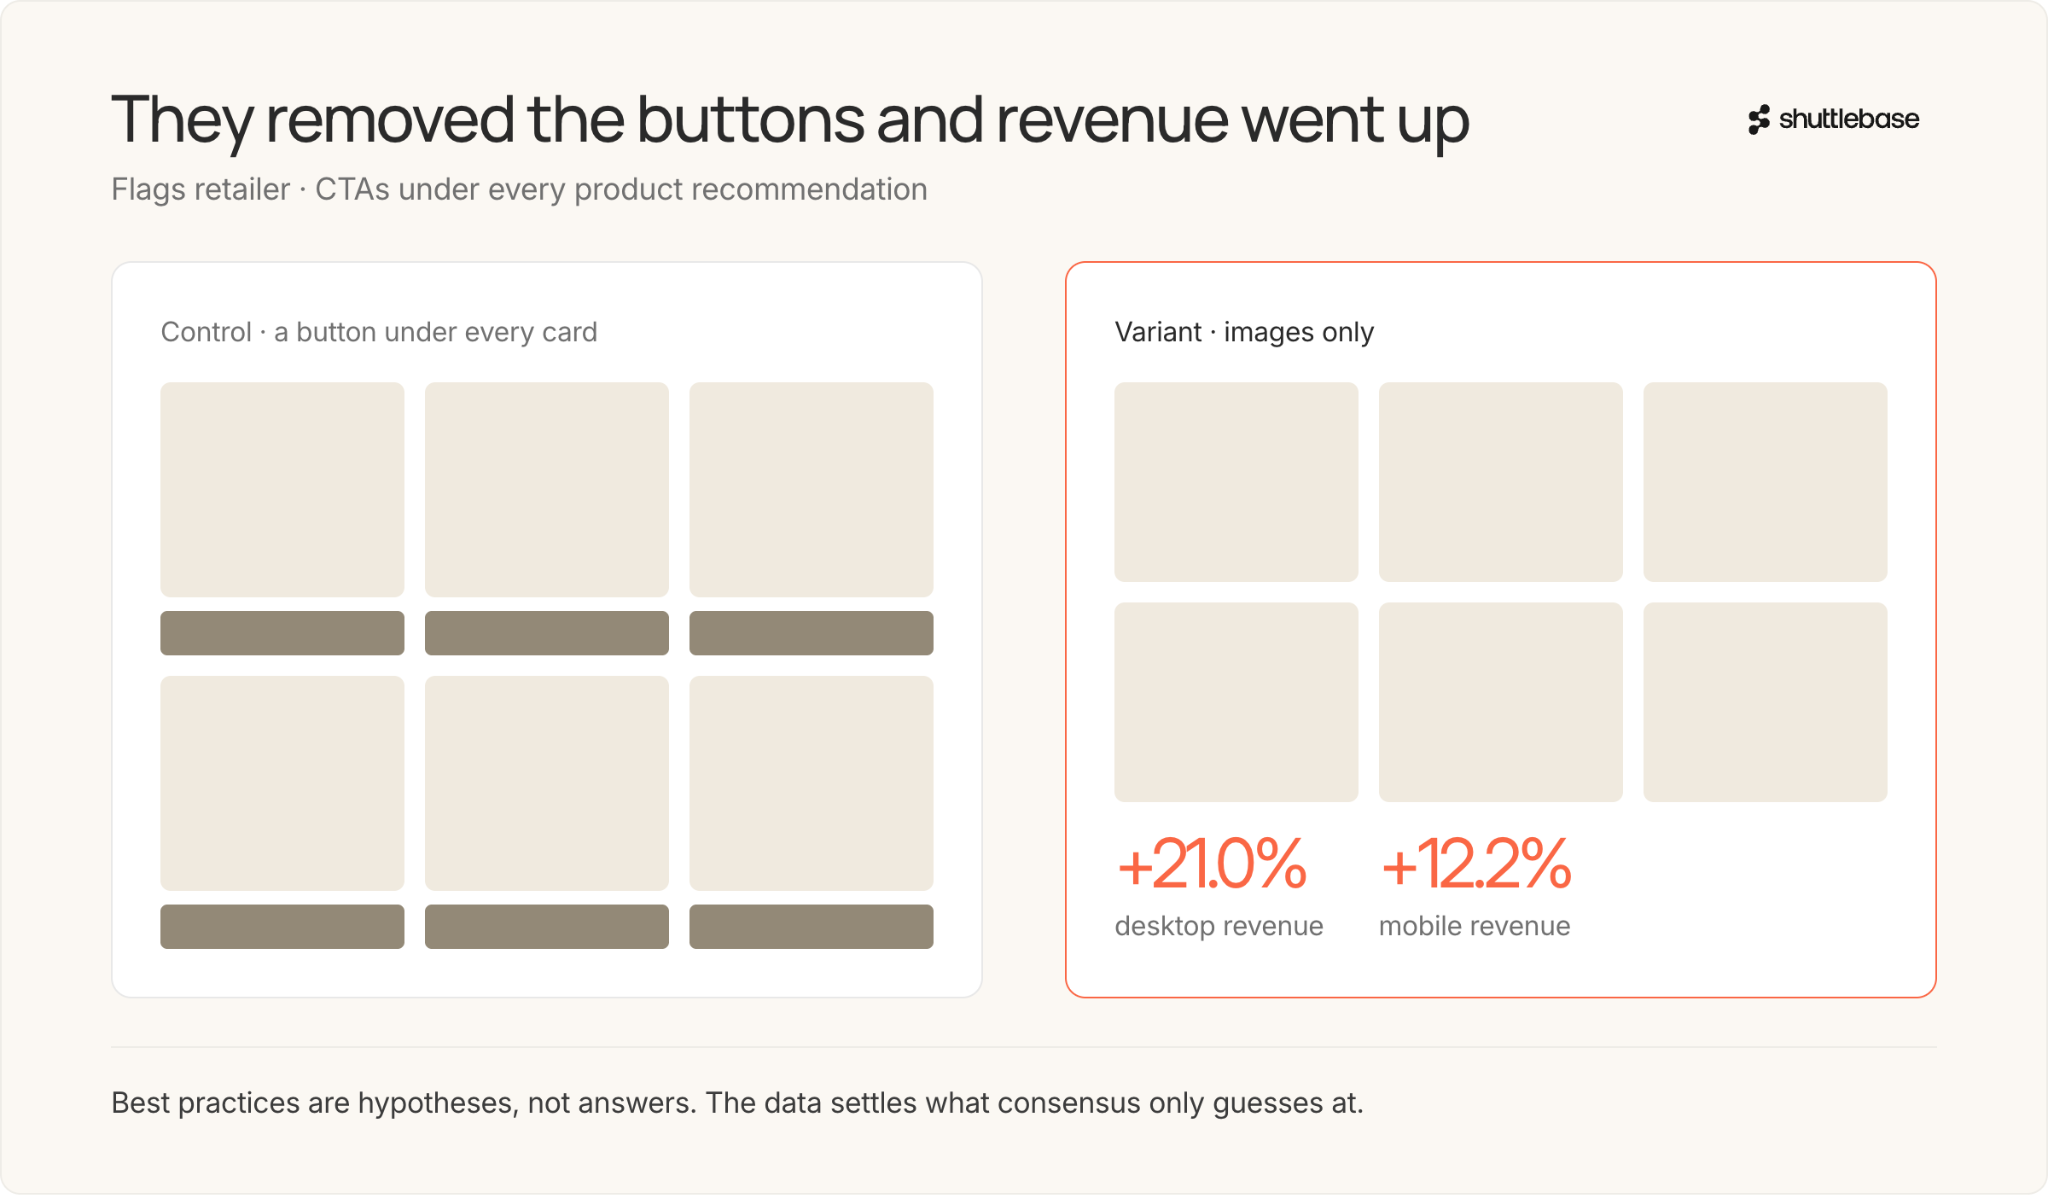
Take, for example, one of our clients, a flags retailer. Their homepage had CTA buttons on its product-recommendation cards (“Shop Now” or “View Details” under every item).
Our AI analyzed the site and hypothesized that those buttons overwhelmed visitors and pulled attention away from the main call to action elsewhere on the page. So they tested removing the buttons under the recommendations, leaving just the images.
The result ran against the standard advice. Desktop revenue rose 21.0 percent, and mobile revenue rose 12.2 percent. Conventional wisdom says more CTAs drive more conversions. Here, removing them made the primary action easier to spot and act on.
This is why CRO relies on testing rather than belief. Data settles what consensus and best practices can only guess at.
What Our Cross-Client Data Shows Wins
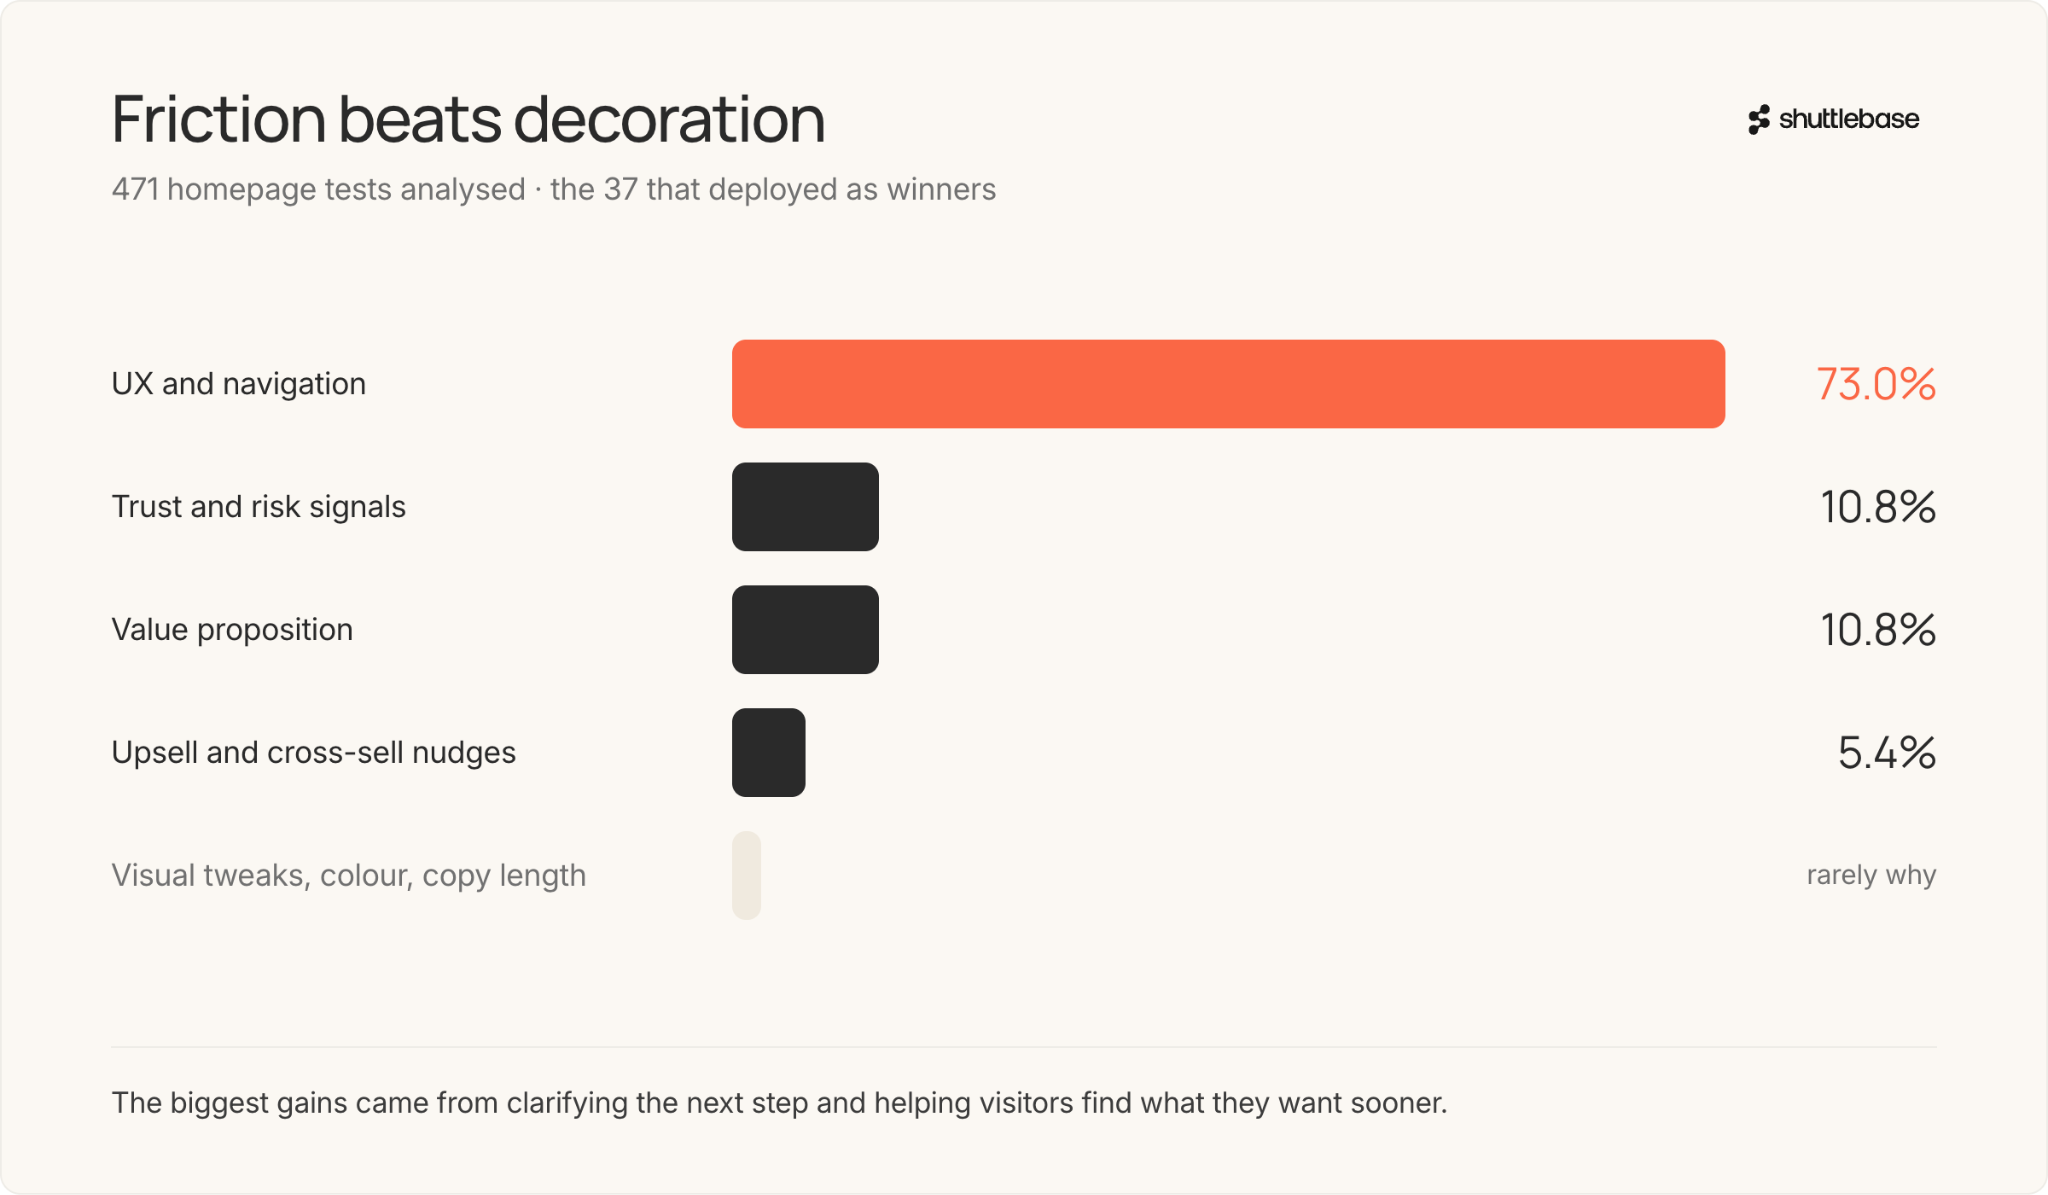
The theme of testing on data holds when looking across experiments run for hundreds of stores. We analyzed 471 homepage tests across ecommerce clients to see which kinds of changes produced wins.
Among the 37 homepage tests that deployed as winners:
- 73.0 percent involved changes in user experience and navigation (clearer menus, prioritizing search, simplifying the first step).
- 10.8 percent focused on trust and risk signals (badges, guarantees, clear returns).
- 10.8 percent adjusted the value proposition (headline, offer, what’s included).
- 5.4 percent tried upsells or cross-sell nudges.
Other categories, like visual tweaks, color, and copy length, occasionally produced small gains but rarely drove a win.
The biggest improvements came from reducing friction, clarifying the next step, and helping visitors find what they want sooner. Upsells and trust signals mattered, but they were the least common source of revenue increases on homepages.
Most Tests Don't Win
Running A/B tests doesn't mean every test works, and most typically fail.
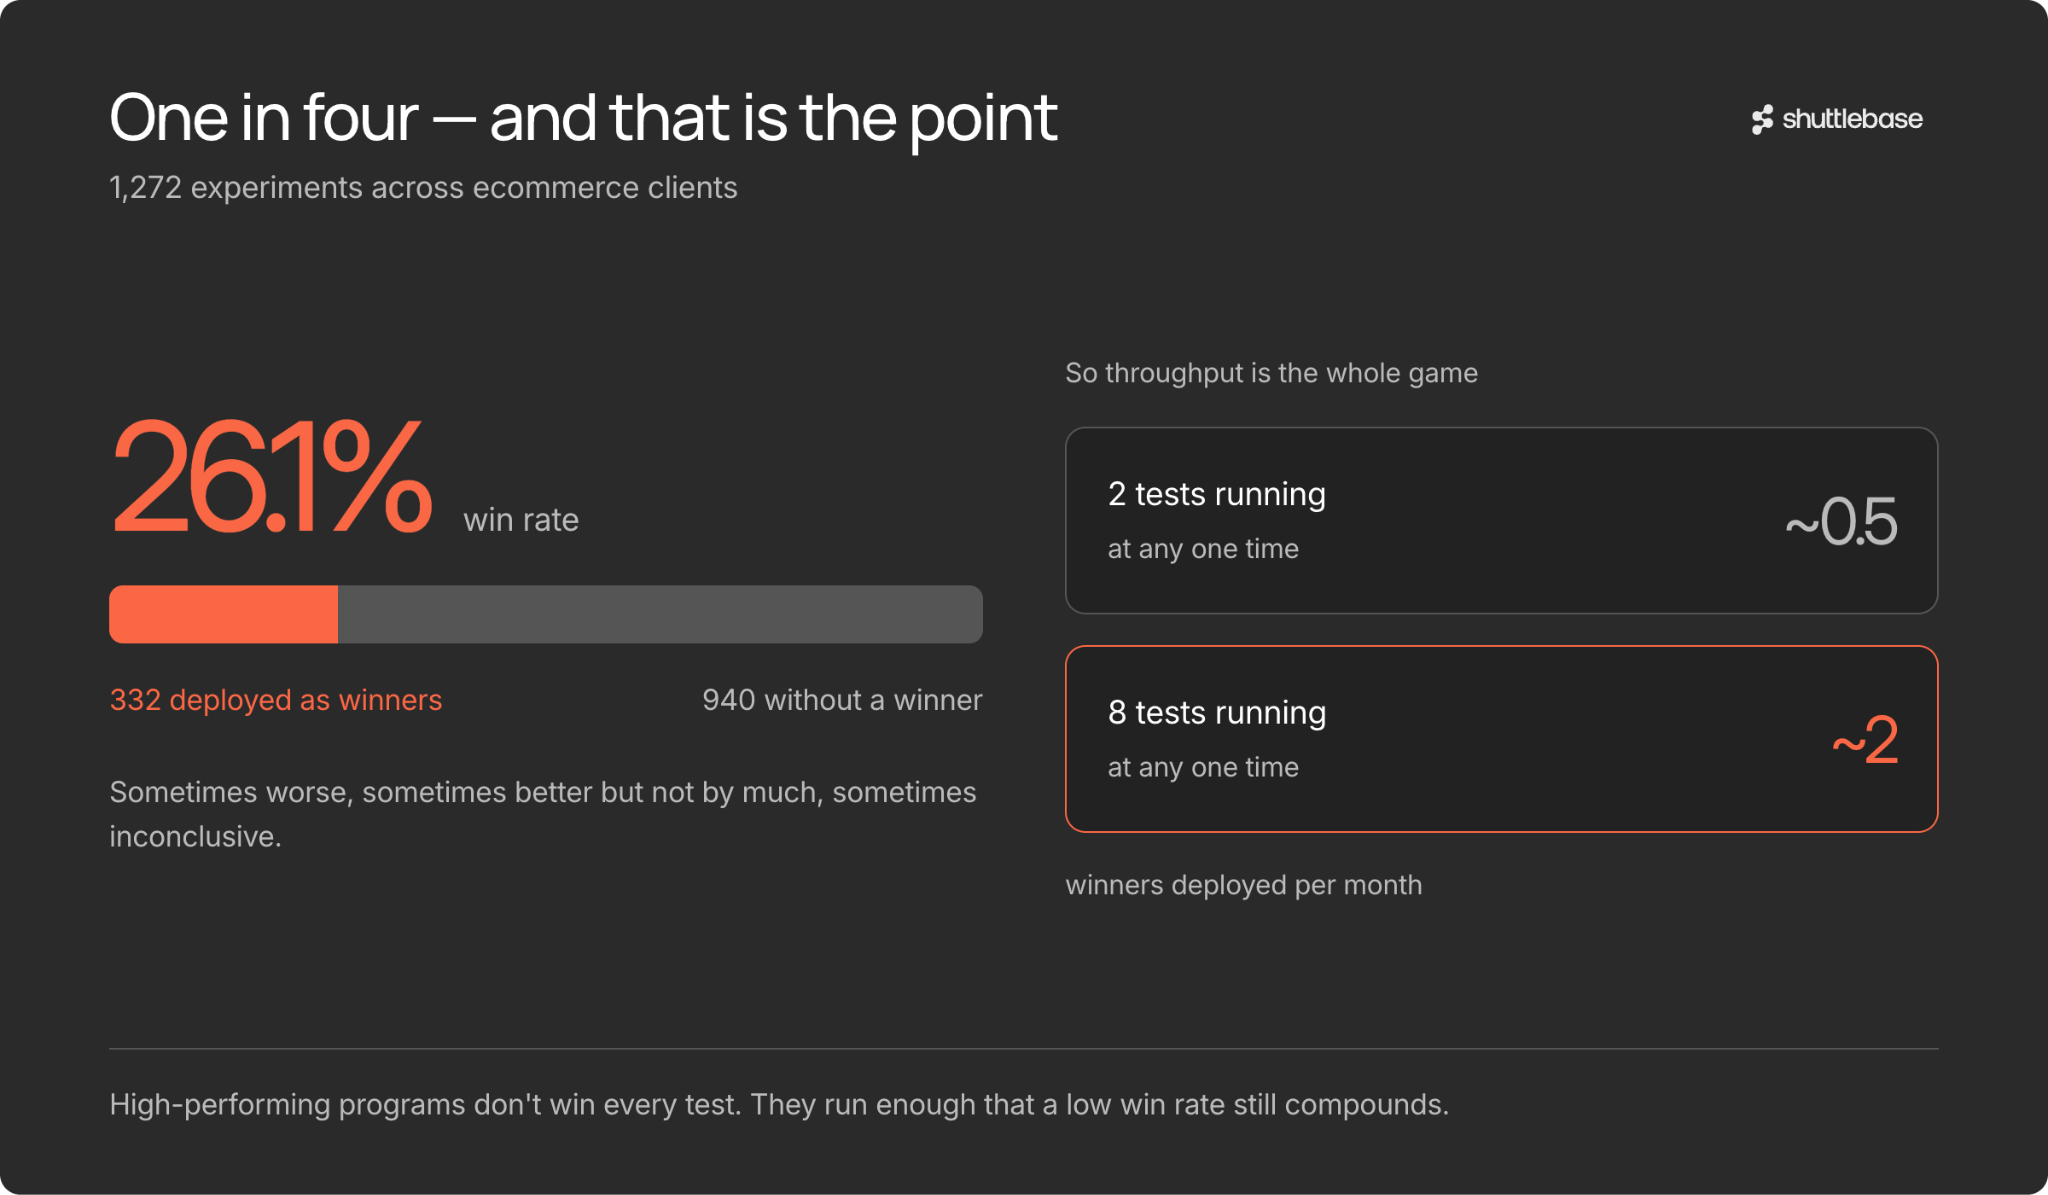
Out of a sample of 1,272 experiments run across our ecommerce clients:
- 332 deployed as winners (adopted to all traffic).
- 940 ended without a winner being deployed.
This is a 26.1 percent win rate. In other words, about one in four tests produces a result strong enough to roll out. Three out of four do not. Sometimes the new version performs worse, sometimes better but not by much, and sometimes the data is inconclusive.
But that's the point. High-performing programs don't succeed because every test wins. They succeed because they run enough tests that even a low win rate produces consistent improvements.
CRO is about discovering what works at scale, then doubling down on the wins.
Why Running CRO Is the Hard Part
If CRO’s process is simple, the logistics are the bottleneck. Programs stall for two major reasons:
- Most tests do not win. The only way to discover what works is to run a high volume of experiments.
- Throughput depends on cross-team work. Traditionally, high test volume has required coordination across design, engineering, analytics, and product, all typically funneled through a developer backlog with slow turnaround.
For example, a program running 2 tests at a time rolls out about half a winner per month, while a program running 8 tests at a time can expect about 2 winners per month.
Getting results from CRO isn't about having every experiment win. It's about running enough experiments that the winners compound over time. If you test every few months, progress takes years, but if you test continuously, you start seeing meaningful gains within months.
Compounding testing means always having another test lined up and ready. That is why the strongest teams build research and ideation pipelines and systems for rapid testing. The knowledge of what to optimize is widely available. The hard part is running through the loop enough times to see the results compound.
Conclusion: CRO Turns Opinion Into Evidence, and Small Wins Compound
CRO isn't a redesign or a one-off project; it's a loop you keep running, test after test, until the small wins start compounding into numbers you can actually see in your revenue. The math is straightforward. The process is repeatable. The only question is whether you commit to running it.
.jpg)
.jpg)
.jpg)