.jpg)
Share this article:
The variables behind every A/B test
Before we get into the math, let's get familiar with the few variables that actually determine how long your A/B test will take. Understanding what they mean will help you decide how much traffic you need, how long to run a test, and how much confidence to put in the results.
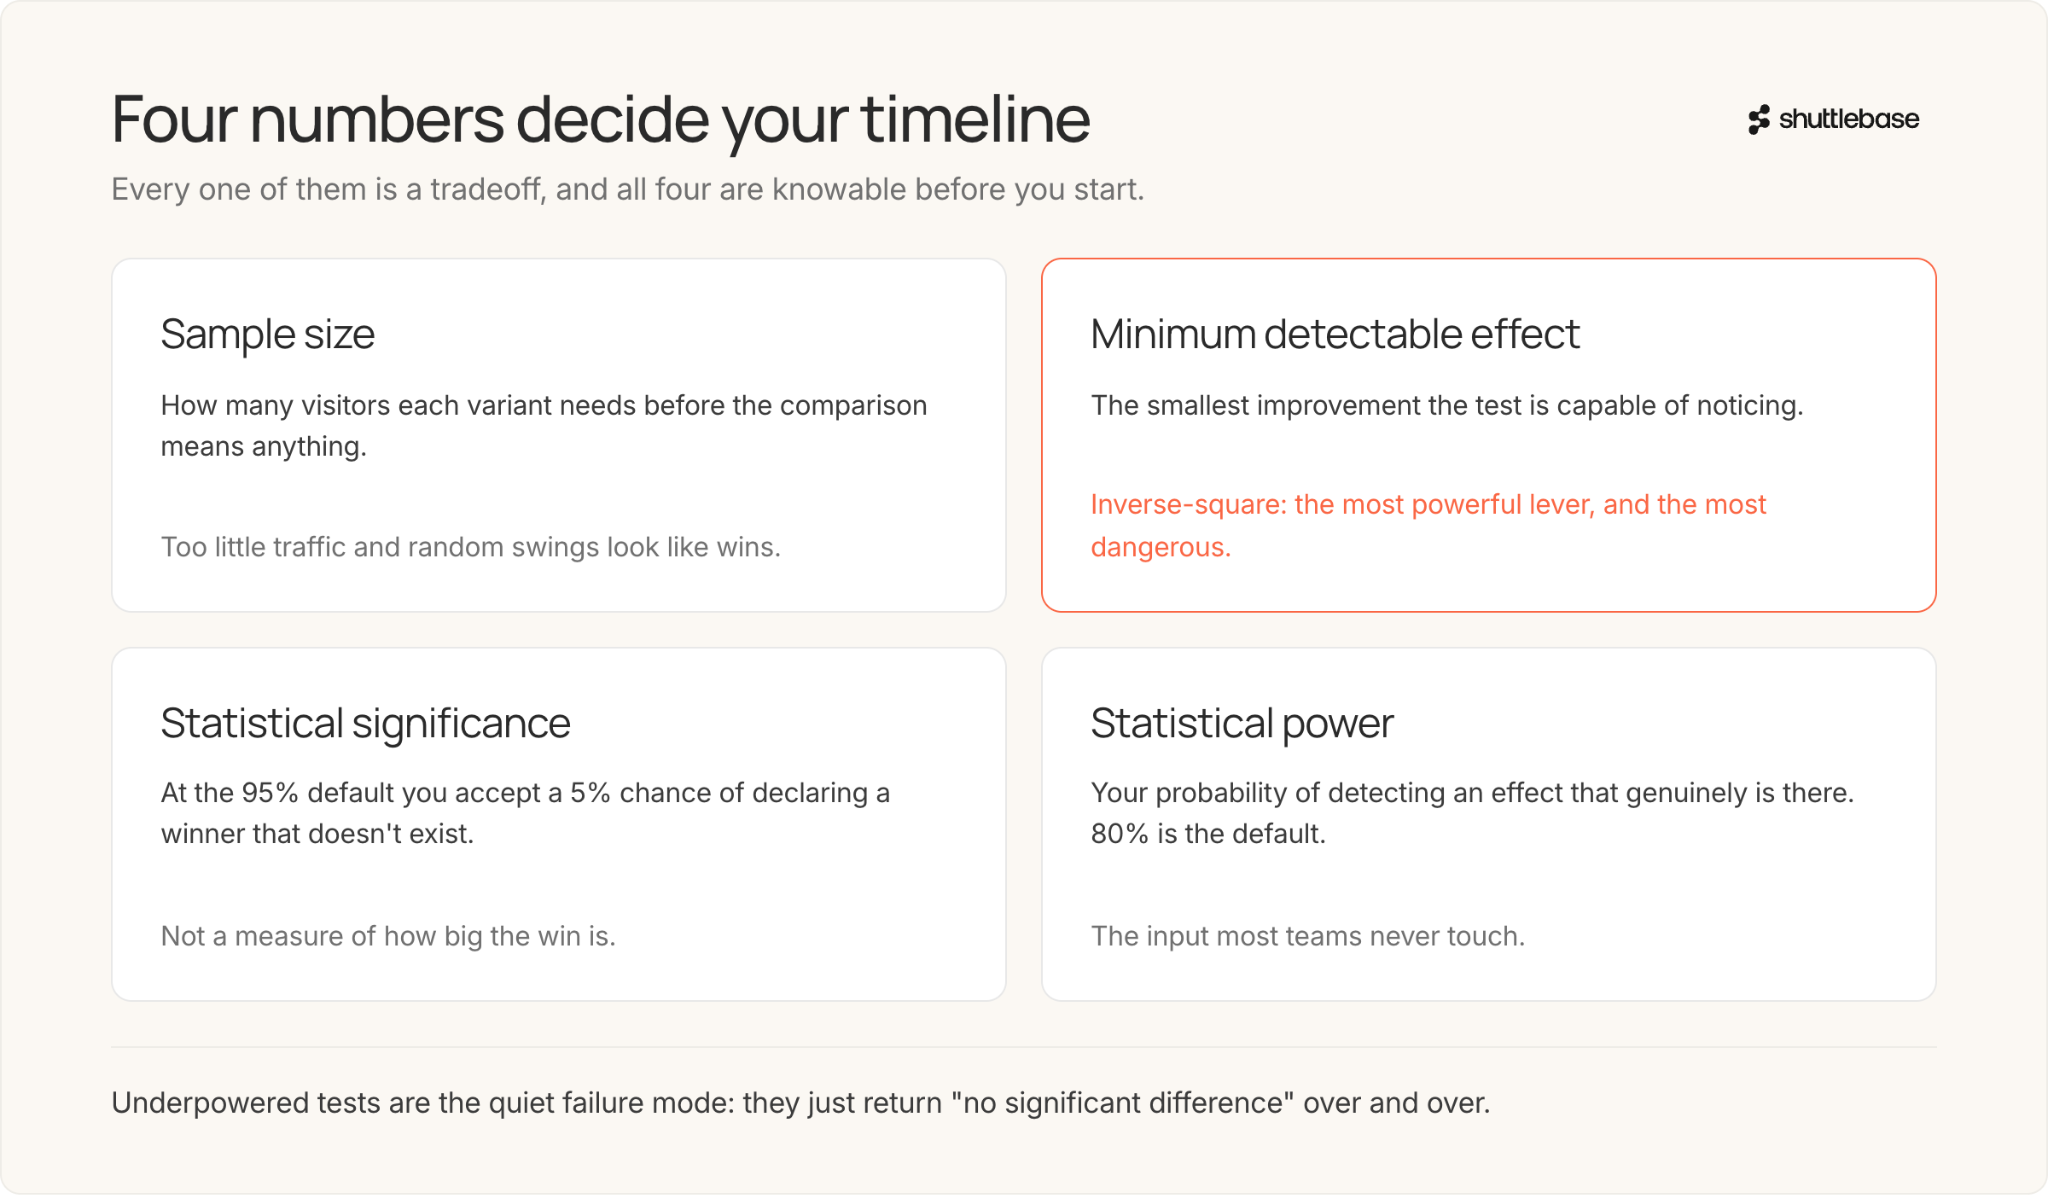
Sample size
Sample size is how many visitors need to see each variant before the test means anything. If you get too little traffic, the random swings can make a small change look like a big win or a clear loser. A larger sample helps you see past that noise and get a more reliable read on what’s actually happening.
Minimum detectable effect
The minimum detectable effect, or MDE, is the smallest improvement you want the test to be capable of noticing. If it’s set too high, you’ll miss smaller wins, but if it's set too low, you’ll need far more traffic and time to reach a result.
Keep a record of the real uplifts your past tests delivered, sorted by how big the change was. A copy tweak and a full page rebuild belong in different brackets, and after a dozen experiments you'll have a far better sense of what's plausible.
Statistical significance
Statistical significance helps you determine whether the result of your test is likely a real improvement or just random variation. At the 95% level, the near-universal default, you’re accepting a 5% chance of declaring a winner that doesn’t actually exist. In other words, it helps answer the question: “How confident are we that this result would hold up beyond this test?”
Statistical power
Where significance protects you from seeing effects that aren't there, statistical power is your probability of detecting an effect that genuinely is there. Underpowered tests are the reason most experiment programs fail. They don't explicitly show up, they just return "no significant difference" over and over, and the team concludes that testing doesn't work here.
A/B Test Duration
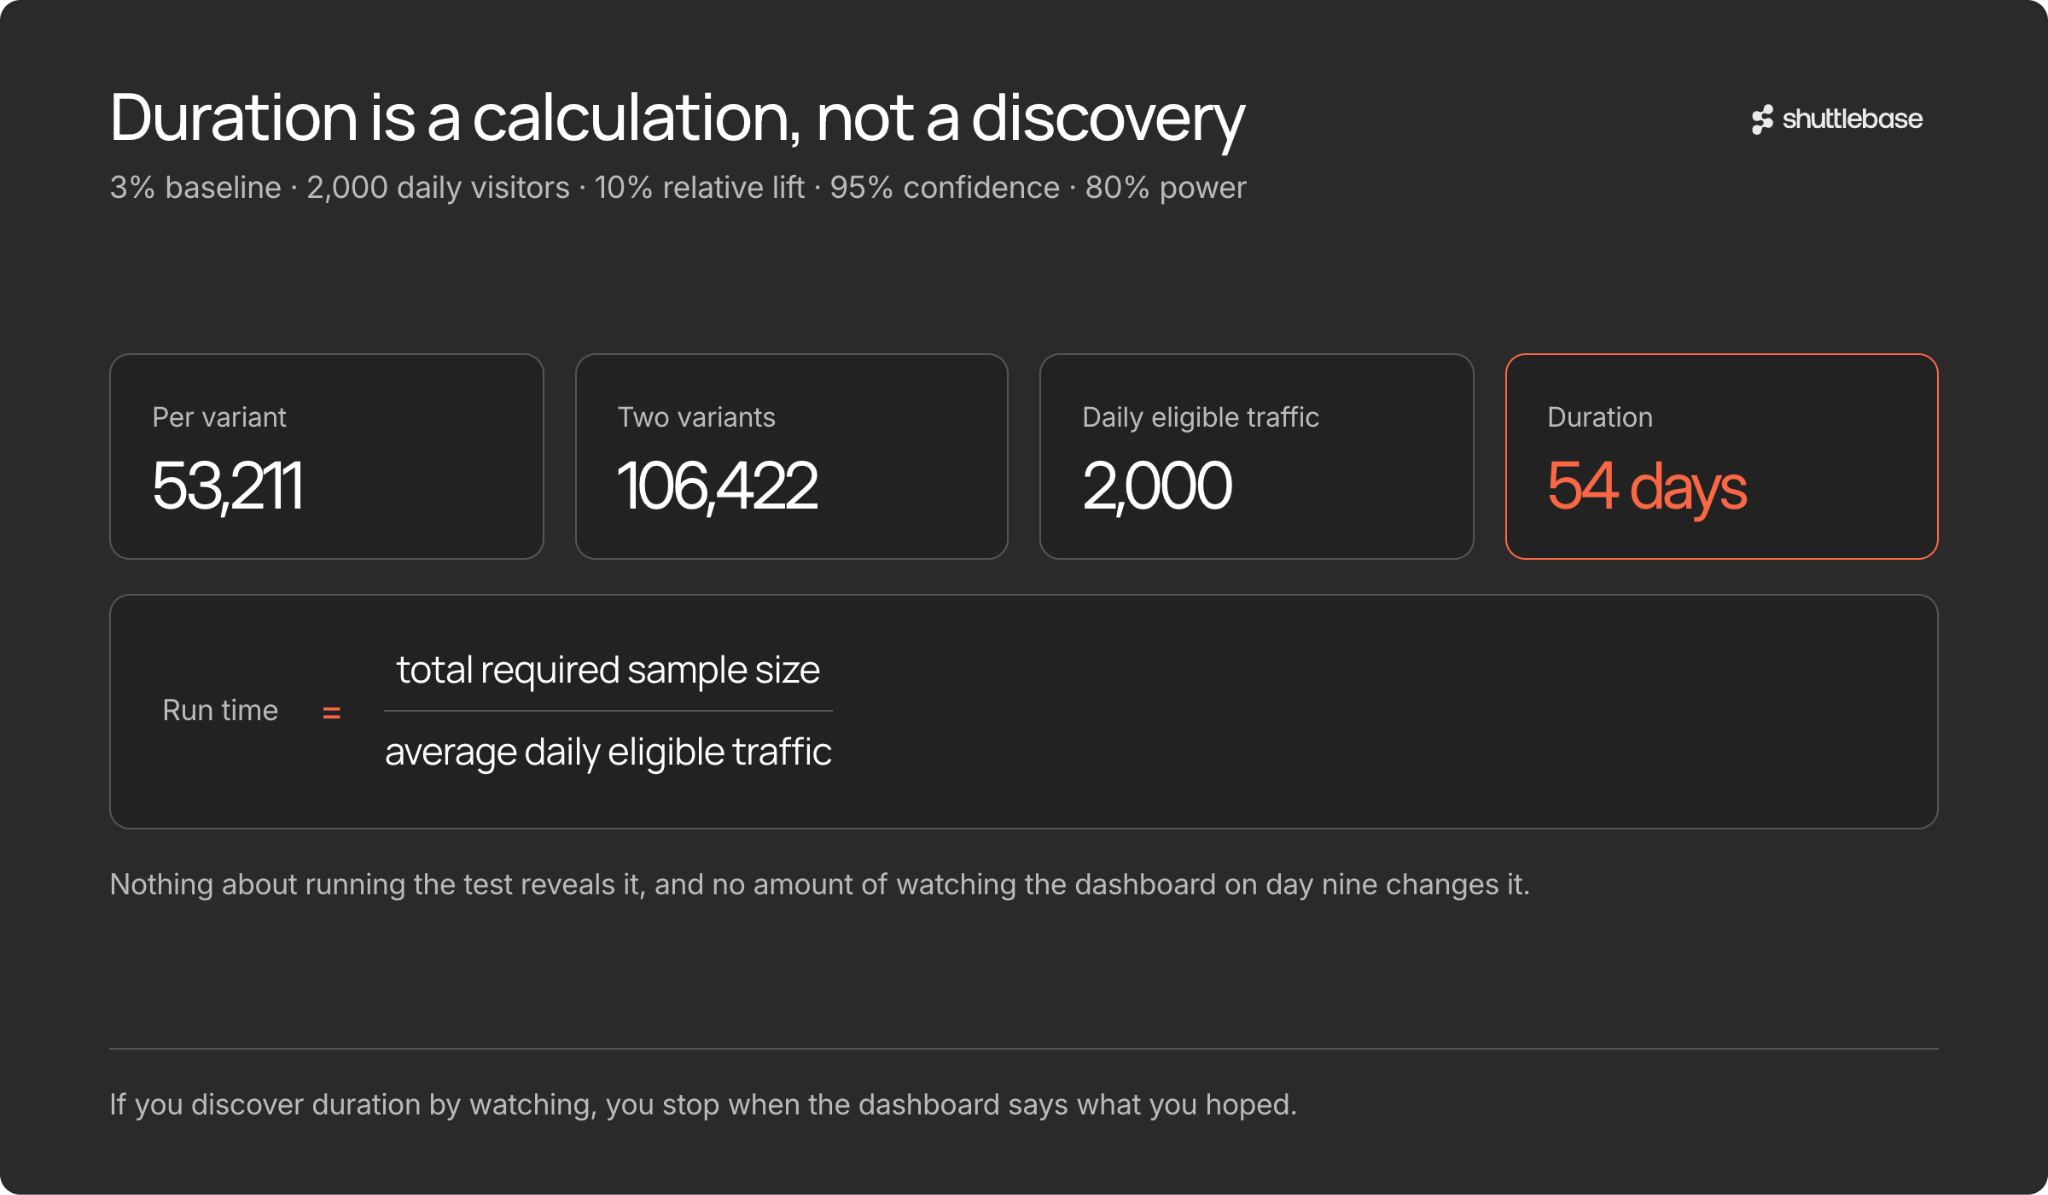
Test duration is a number you calculate before the test starts. This calculation itself is simple:
Test run time = Total required sample sizeAverage daily eligible traffic
Always define the duration before starting the test. If you choose your duration time by watching the test live, you'll check the dashboard daily and stop when the numbers look like what you were aiming for. But if you calculate duration ahead of time, you'll stop testing when you said you would, and the result will mean what it claims to mean.
Consider a store converting at 3% with 2,000 daily visitors on the page being tested, hoping to detect a 10% relative improvement, moving 3% to 3.3%. At 95% confidence and 80% power, that test needs 53,211 visitors per variant. With two variants, that's 106,422 people, and at 2,000 a day it takes 54 days.
Fifty-four days is the answer. It was knowable on day zero. Nothing about running the test reveals it, and no amount of watching the dashboard on day nine changes it.
How to Calculate Test Time
Map your traffic before you plan a single test
Work out how much traffic each testable area of your site actually receives and how often it converts, then keep that number someplace you can reference. Teams often discover that a page they queued for a series of tests gets a fraction of the traffic it needs to be successful.
Use a calculator, then sanity-check it
Nobody computes sample sizes by hand. You plug in your baseline conversion rate, the effect you want to detect, your confidence and power settings, and your daily traffic. The calculator then tells you your sample size and the testing duration.
What it won't do is tell you whether your inputs make any sense. It’ll be on you to sanity-check. Ask yourself, does the timeline actually fit inside a quarter? Does the minimum detectable effect match anything your site has ever actually produced? Will the test wrap up before the season shifts underneath it?
Set a conversion floor and respect it
Sample size tells you how many visitors you need, but significance depends on conversions, and the two diverge badly on low-converting pages. A common working rule among practitioners is not to call any test with fewer than 100 conversions per variant, regardless of what the significance figure says.
The reasoning is that with very few conversions, a handful of individual purchases can flip the result. Thirty conversions versus forty looks like a 33% improvement and is entirely consistent with nothing happening at all.
Why stopping an A/B test early is a problem
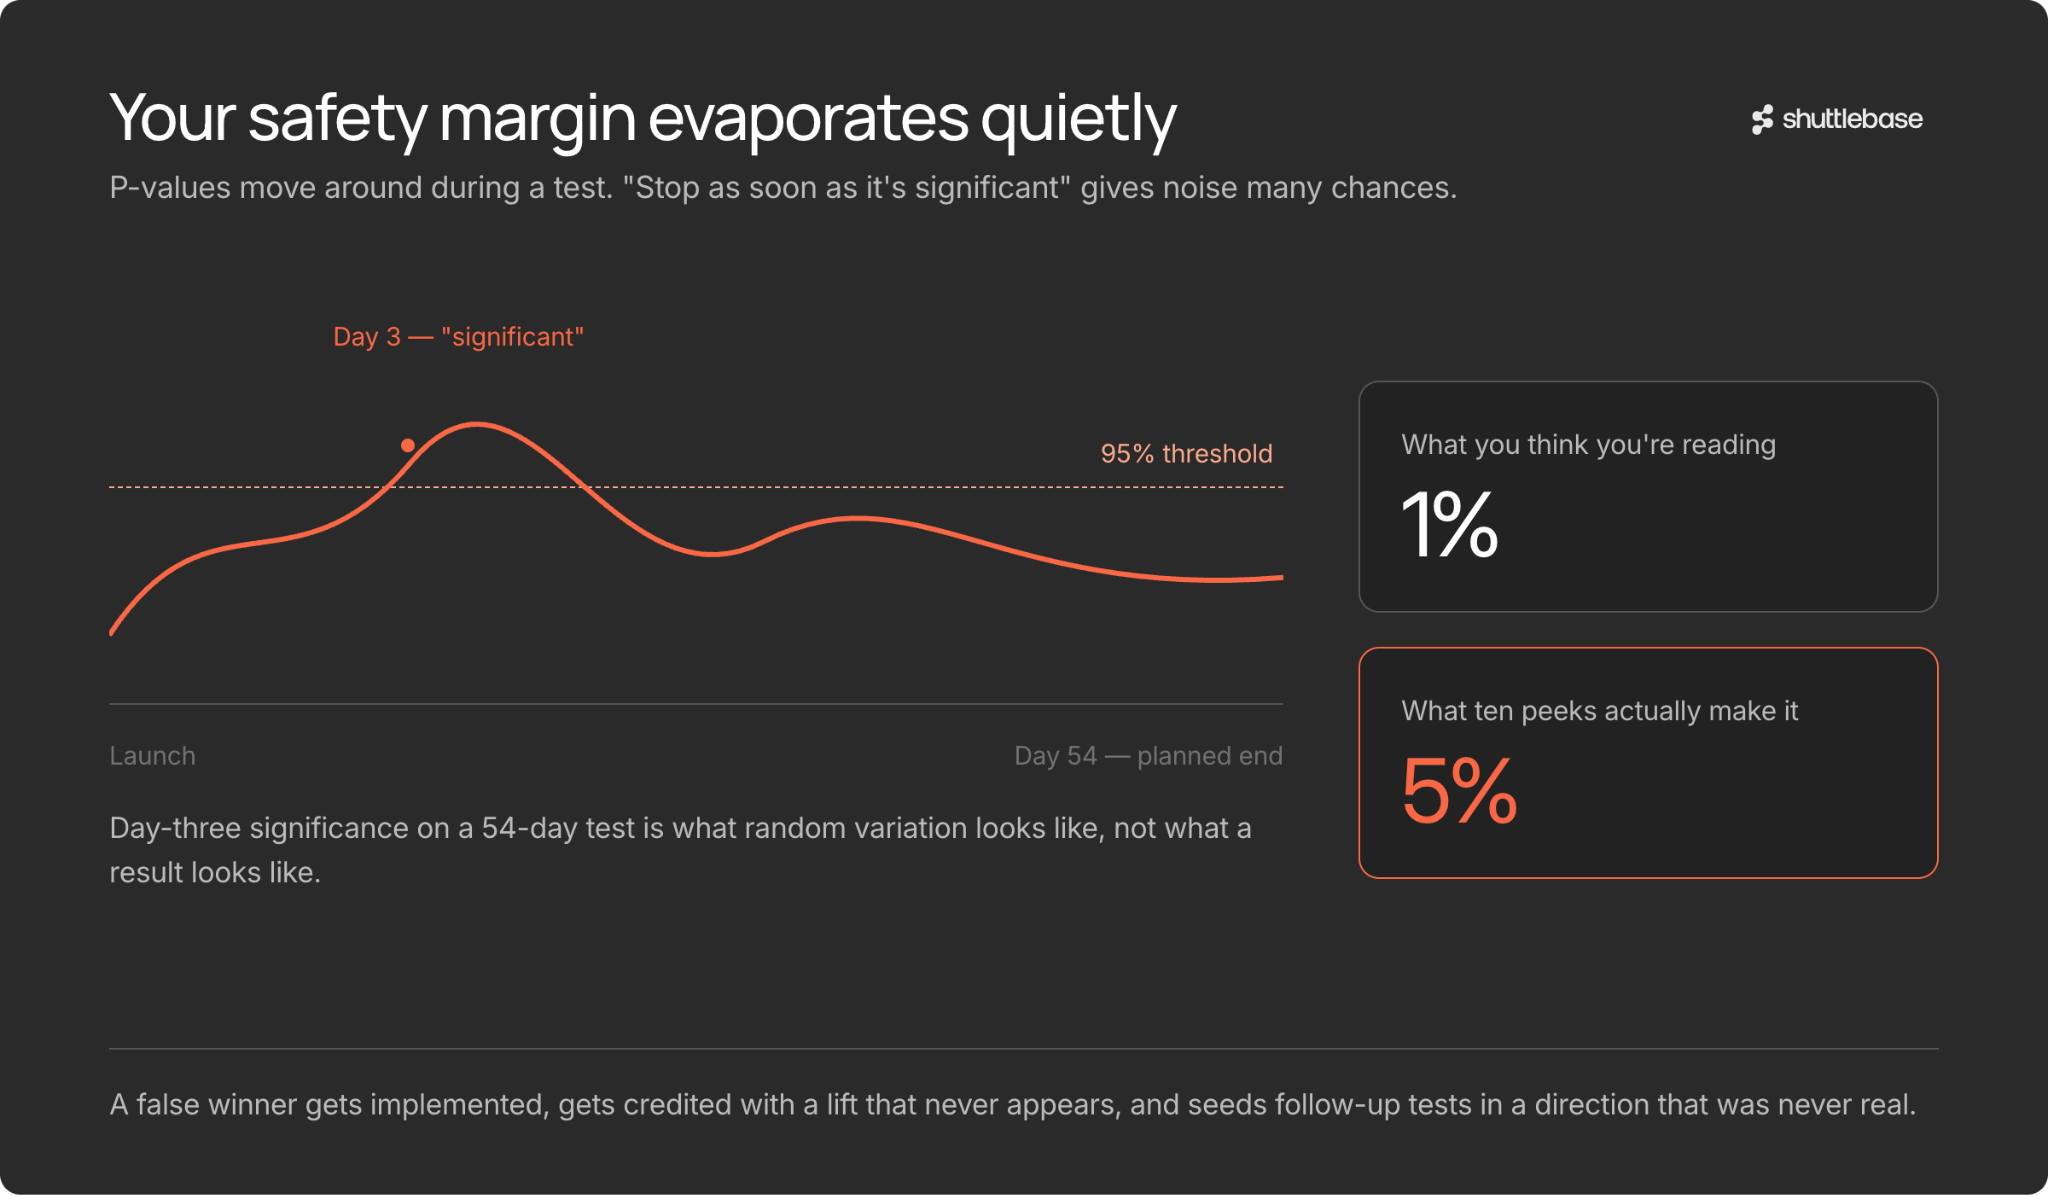
Checking in the middle of a testing cycle and stopping the test the moment it crosses the significance threshold is called peeking.
P-values don't sit still while a test runs. They drift up and down. If your plan is to check in every few days and stop the moment you see significance, you're basically giving yourself repeated chances to catch a random fluctuation. Eventually you will, even when nothing real is going on. And the damage this does to your error rate is worse than most people think.
If you check a running experiment ten times, what looks like 99% confidence is actually closer to 95%. That matters because a false winner doesn't just waste one test. It gets shipped, someone credits it with a lift that never shows up in the real numbers, and then the next round of tests starts exploring a direction that was never there to begin with.
When you can stop a test early
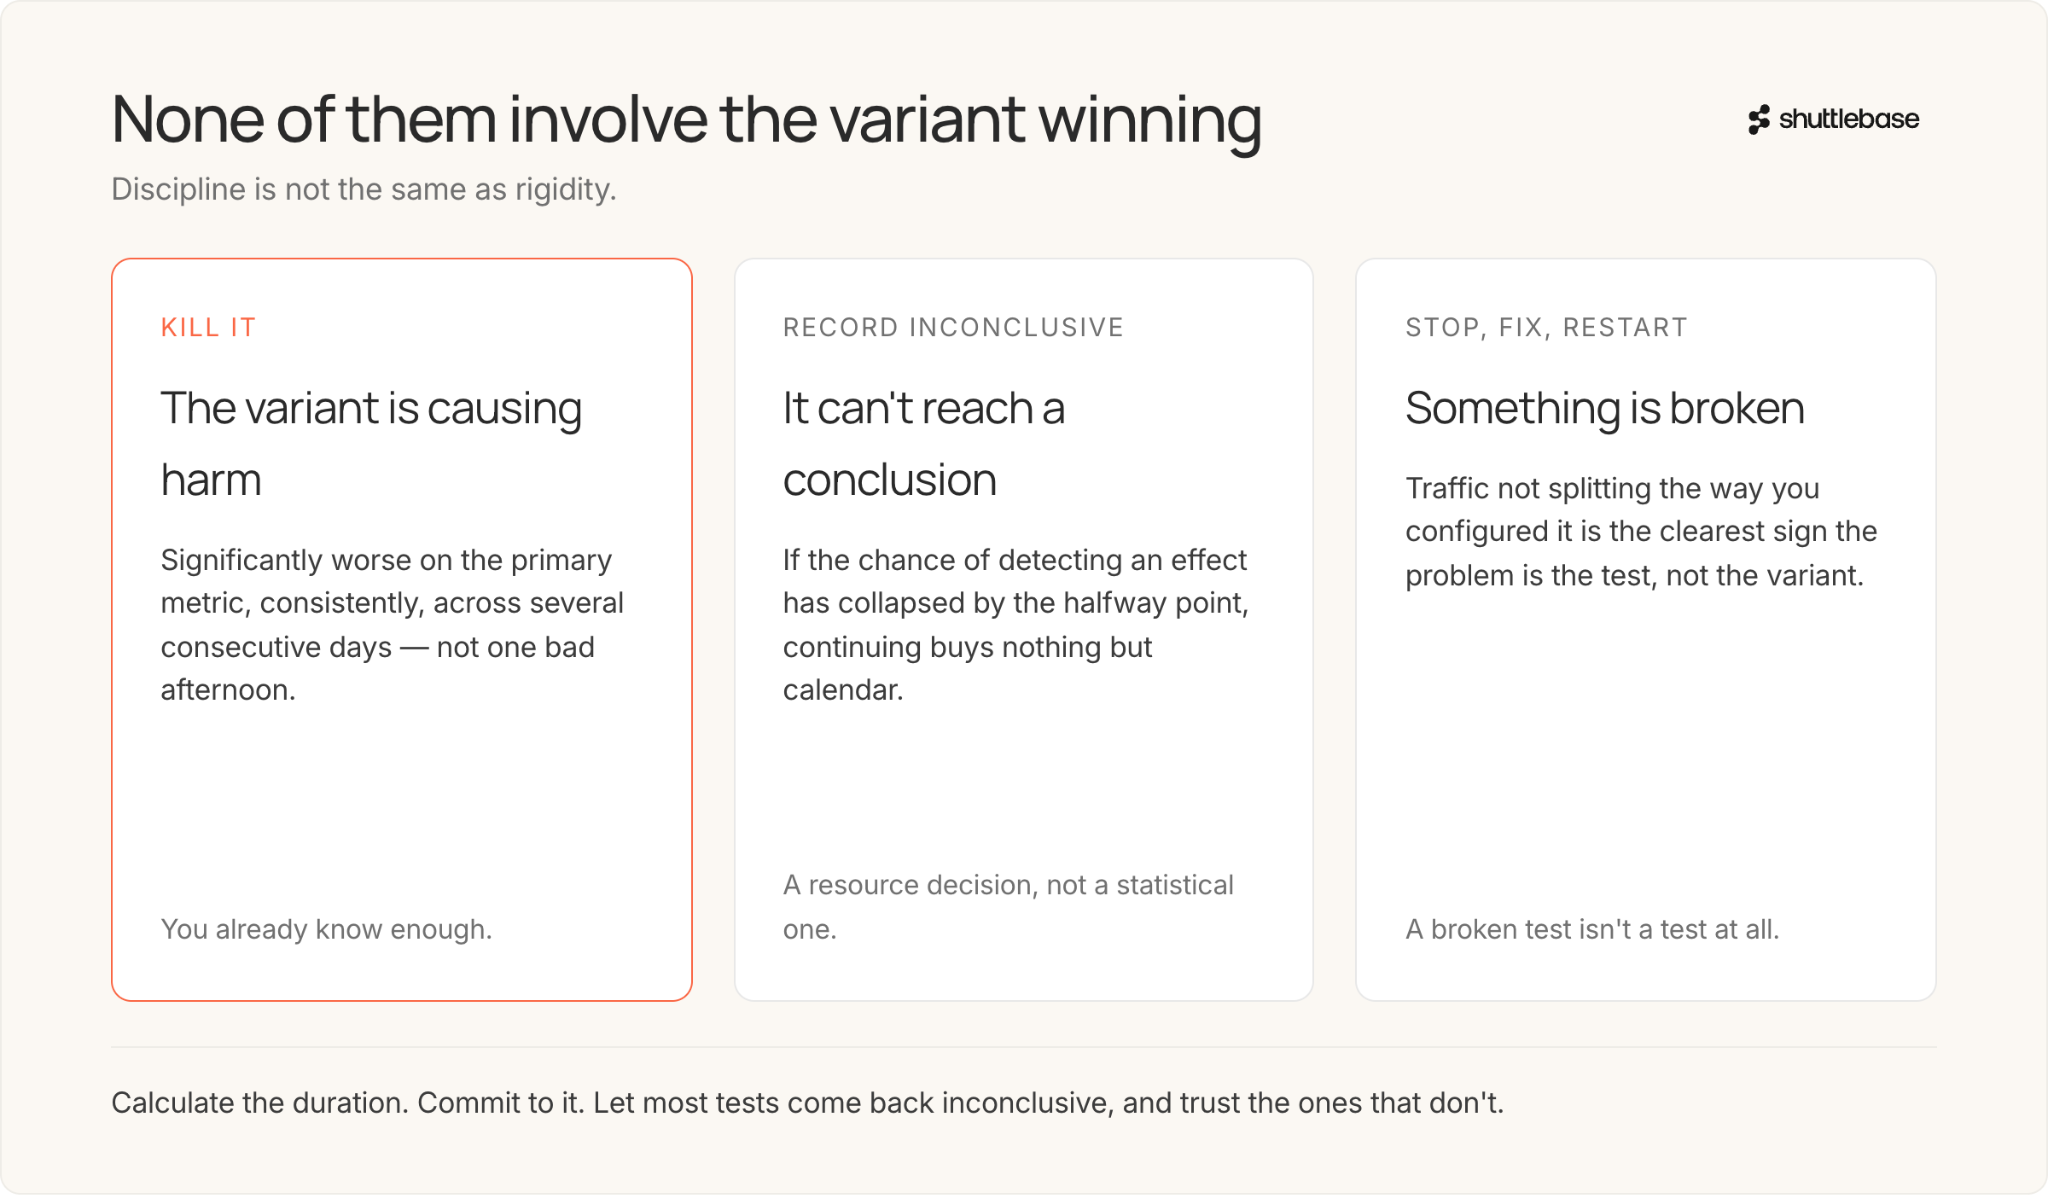
Three situations justify ending a test before its planned duration, and none of them involve the variant winning.
The variant is clearly causing harm. If a version performs significantly worse on your primary metric consistently across several consecutive days, the cost of continuing outweighs the value of the additional data. You already know enough. Kill it.
The test cannot reach a conclusion. Partway through, you can assess whether the experiment still has a realistic chance of detecting an effect given how it's tracking. If that probability has collapsed by the halfway point, continuing buys you nothing but calendar. Stopping here is a resource decision, not a statistical one, and the correct conclusion to record is "inconclusive," not "no difference."
Something is broken. Where traffic isn't splitting the way you configured it is the clearest signal that something is wrong with the test rather than with the variant. A broken test isn't a test at all, and the right move is to stop, fix, and restart the clock.
The duration you should plan around
If you need a single figure for planning purposes, assume one test takes four weeks; expect two at the fastest and eight when the page converts poorly, or the effect you're chasing is small.
But the more useful thing to internalize is that "how long until significance" isn't a property of A/B testing at all. It's a property of your traffic, your conversion rate, and how small an effect you're willing to chase, and it's fully knowable before you write a line of code.
Calculate the duration and commit to it. Let most of your tests come back inconclusive, and trust the ones that don't.
Conclusion
Most A/B tests fail because someone skipped the math entirely. They eyeball the duration, peek at the dashboard, stop early when the numbers look good, and ship changes that never really worked. Calculate your duration before you start, commit to it, and let the test run. You'll get fewer winners that way, but the ones you get will actually hold up when the revenue numbers come in.
We build CRO programs that run on real numbers, not gut feel. If you're not sure whether your site has the traffic to support the tests you're planning, or you've been running experiments that never seem to reach significance, we can help you figure out what's actually testable and build a roadmap that fits. Reach out for a demo to learn more.
.jpg)
.jpg)
.jpg)