.jpg)
Share this article:
Target A/B testing metrics
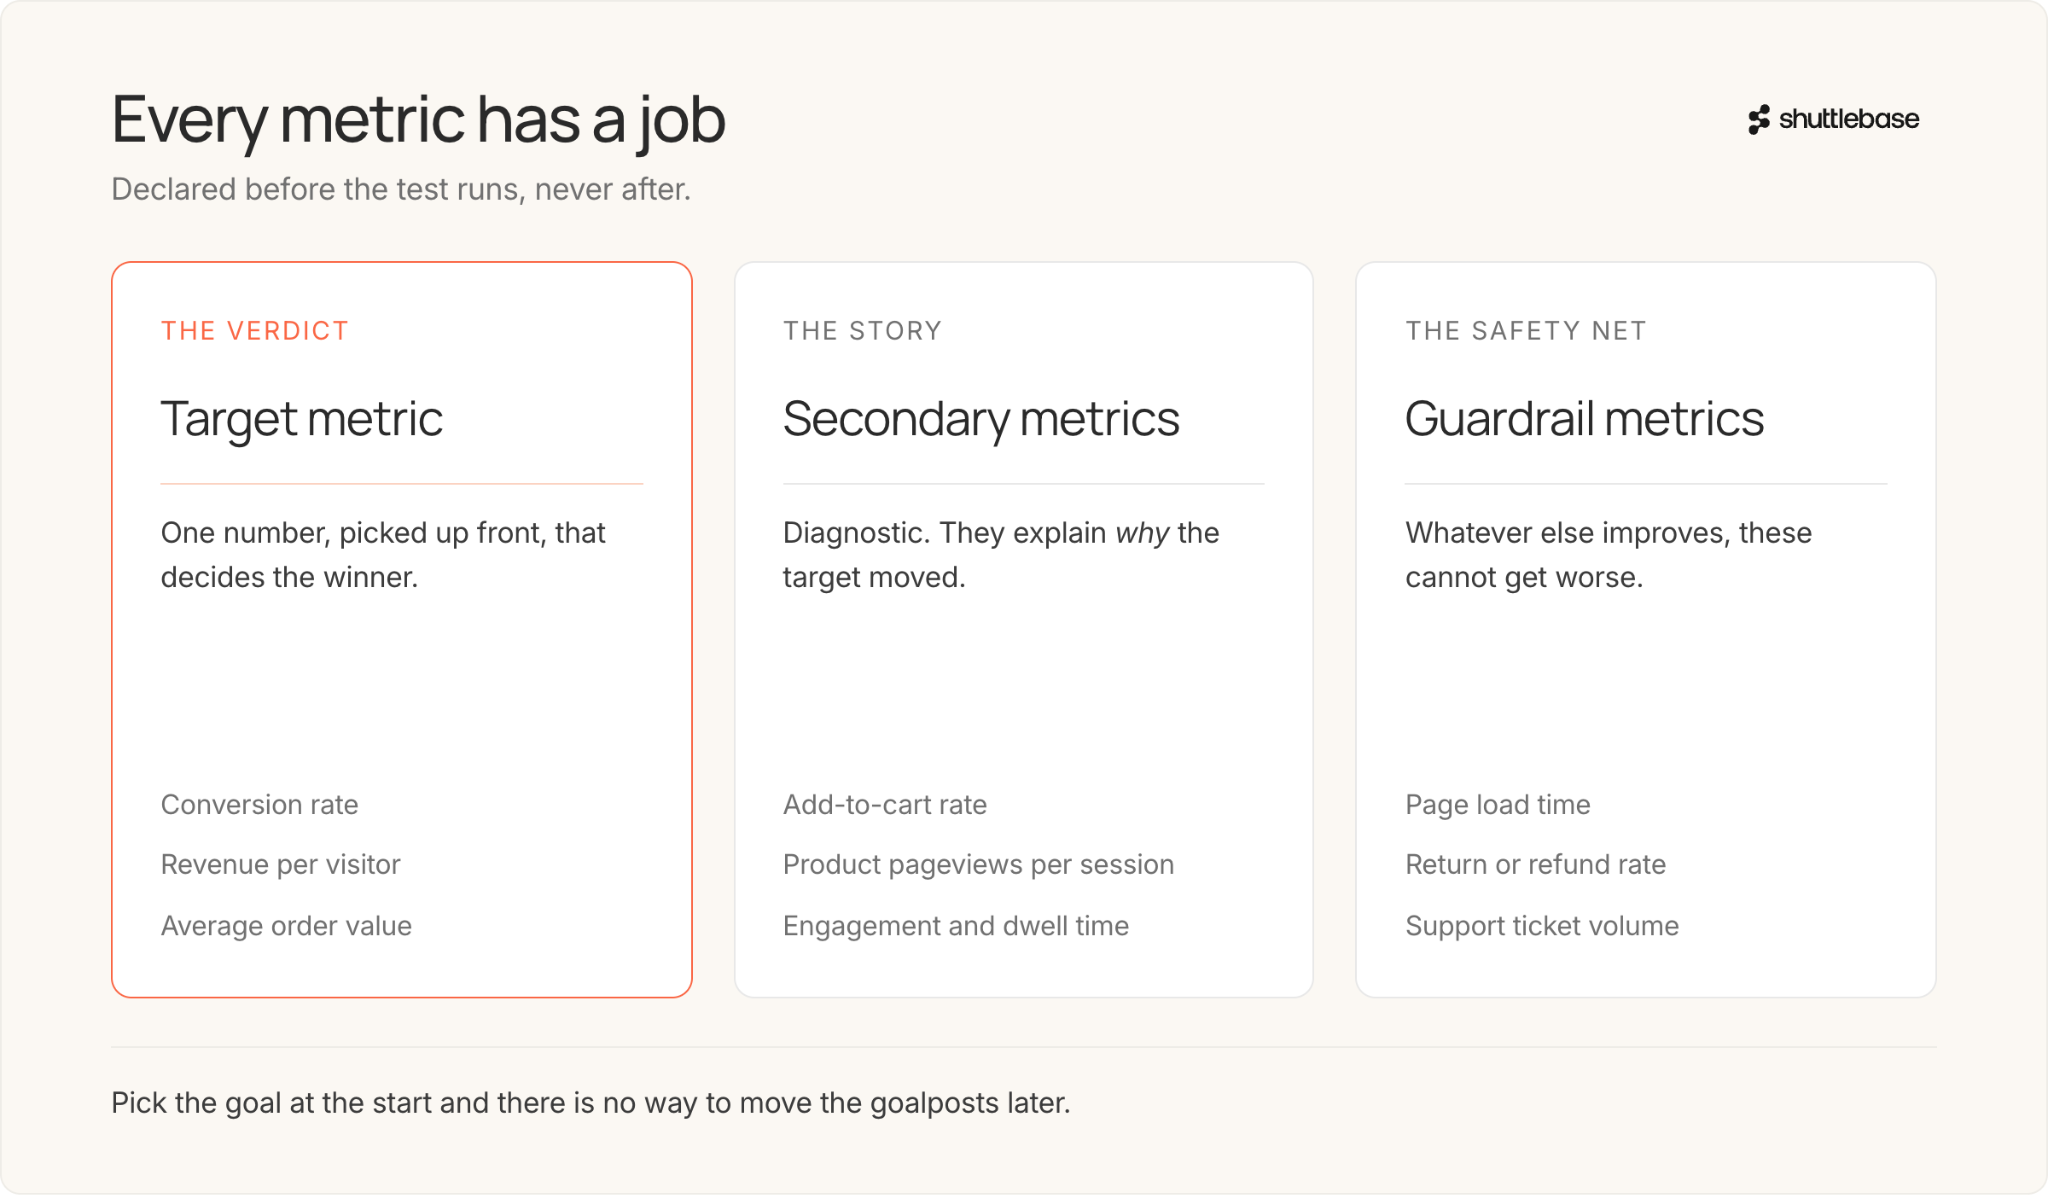
Every A/B test starts with figuring out the outcome you most want to improve. That is your target metric. This can also be called the “primary metric.” It’s the number you want to improve that you declare up front before the test runs. That metric, whether conversion rate, revenue per visitor, or average order value, will decide whether the test wins or not.
Before you begin A/B testing, decide which target metric you want to improve. If you pick the goal at the start, there is no way to move the goalposts later to make a weak result look good. It keeps your testing honest.
When you’re picking a metric, choose the one that lines up with what the test is meant to improve. If the test is meant to move customers towards checkout and boost sales, use conversion rate or revenue per visitor. If the test aims to increase order size, use average order value.
Supporting metrics
A single metric does not tell the whole story. The supporting metrics fill in the gaps. They come in two main types: secondary metrics and guardrail metrics. Most A/B testing tools frame the split as primary vs secondary metrics, and treat guardrails as a special kind of secondary metric.
Secondary metrics
Secondary metrics help you understand why the target metric changed. They are diagnostic, showing what happened within the customer journey. Common secondary metrics include:
- Add-to-cart rate (how often shoppers add a product to their cart)
- Product pageviews per session (how many product pages are visited during a session)
- Average order value (what is the average cost in a cart)
- Engagement or dwell time (how long are buyers staying on your site)
Suppose conversion rate increases, but the average order value drops hard. Or add-to-cart rate rises, but purchases do not. These secondary metrics help you explain what caused the shift in your target outcome.
Guardrail metrics
While secondary metrics explain why the target changed, guardrail metrics help you spot unexpected negative effects early and help to prevent you from shipping a change that will have a negative long-term impact. In ecommerce, these can include:
- Page load time (slower pages can hurt your whole funnel)
- Bounce rate (how many leave without seeing another page)
- Return or refund rate (are you moving bad-fit sales?)
- Customer support volume (did something get confusing enough that more shoppers are writing in?)
- Revenue and conversion rate (unless the positive change offset these significantly)
You pick guardrails with a clear rule: “Whatever else improves, this number cannot get worse.” Otherwise, a simple win on your target could hide a deeper loss.
How metrics play different roles: examples from our tests
One of our furniture brands ran a test on a side-cart layout, which is the panel that lets shoppers view and edit their cart without leaving the page. The target metric was to increase clicks on the checkout button by reducing distractions and clarifying the next step.
After running the test, they found that simplifying the side cart worked. Checkout clicks increased by 26.8% with 100% statistical confidence.
In this case revenue per visitor was used as a guardrail metric to make sure the new design didn't unintentionally hurt sales. Revenue per visitor changed by -0.1% with only 2% statistical confidence, meaning there was no meaningful impact on revenue. With checkout clicks up and revenue unchanged, we deployed the simpler side cart.
With this approach, you set the target metric for success and guardrail metric for safety before you run the test.

When target and supporting metrics agree
The best case is simple. Your target metric wins, and the supporting metrics form a clear, sensible story. That makes the “let’s ship this on our website” call easy.
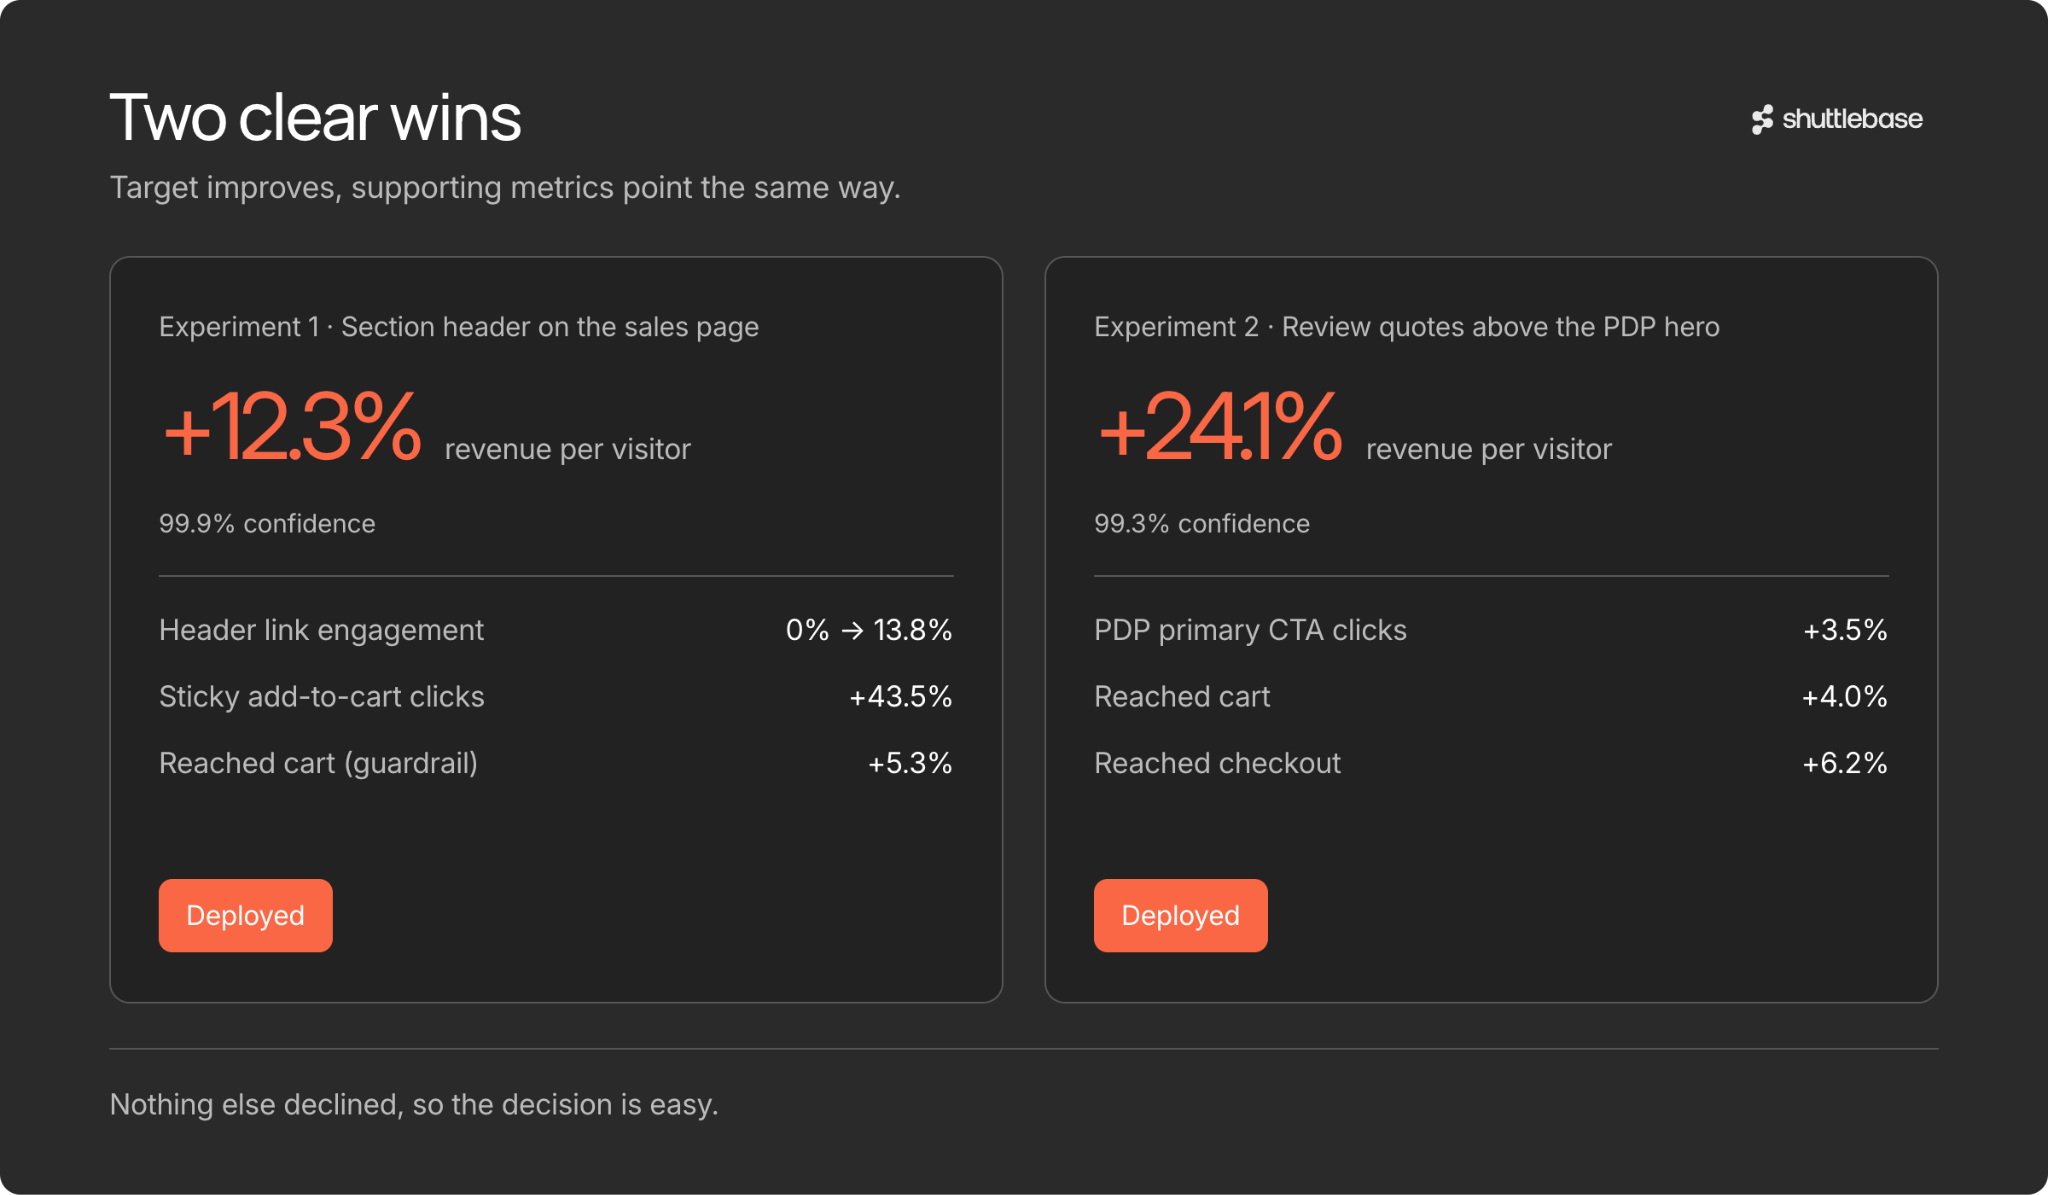
These two experiments show how the process works in practice. Each had a clear target success metric, supporting metrics to explain why it worked, and a final deployment decision.
Experiment 1: Add a section header to the sales-page
- Target: Revenue per visitor +12.3% (99.9% confidence)
- Supporting:
- Header link engagement 0% → 13.8%
- Sticky Add-to-Cart clicks +43.5% (100% confidence)
- Guardrail: Reached Cart +5.3%
- Decision: Deployed
Experiment 2: Review quotes added above the product page hero
- Target: Revenue per visitor +24.1% (99.3% confidence)
- Supporting:
- PDP primary CTA clicks +3.5%
- Reached Cart +4.0%
- Reached Checkout +6.2%
- Decision: Deployed
When the target metric improves and the supporting metrics point in the same direction, you can be confident the result is real. Nothing else declined, so the decision is clear to deploy the winning version on the website.
When target and supporting metrics disagree
Sometimes the numbers conflict. The target metric improves, but a supporting or guardrail metric raises a red flag.
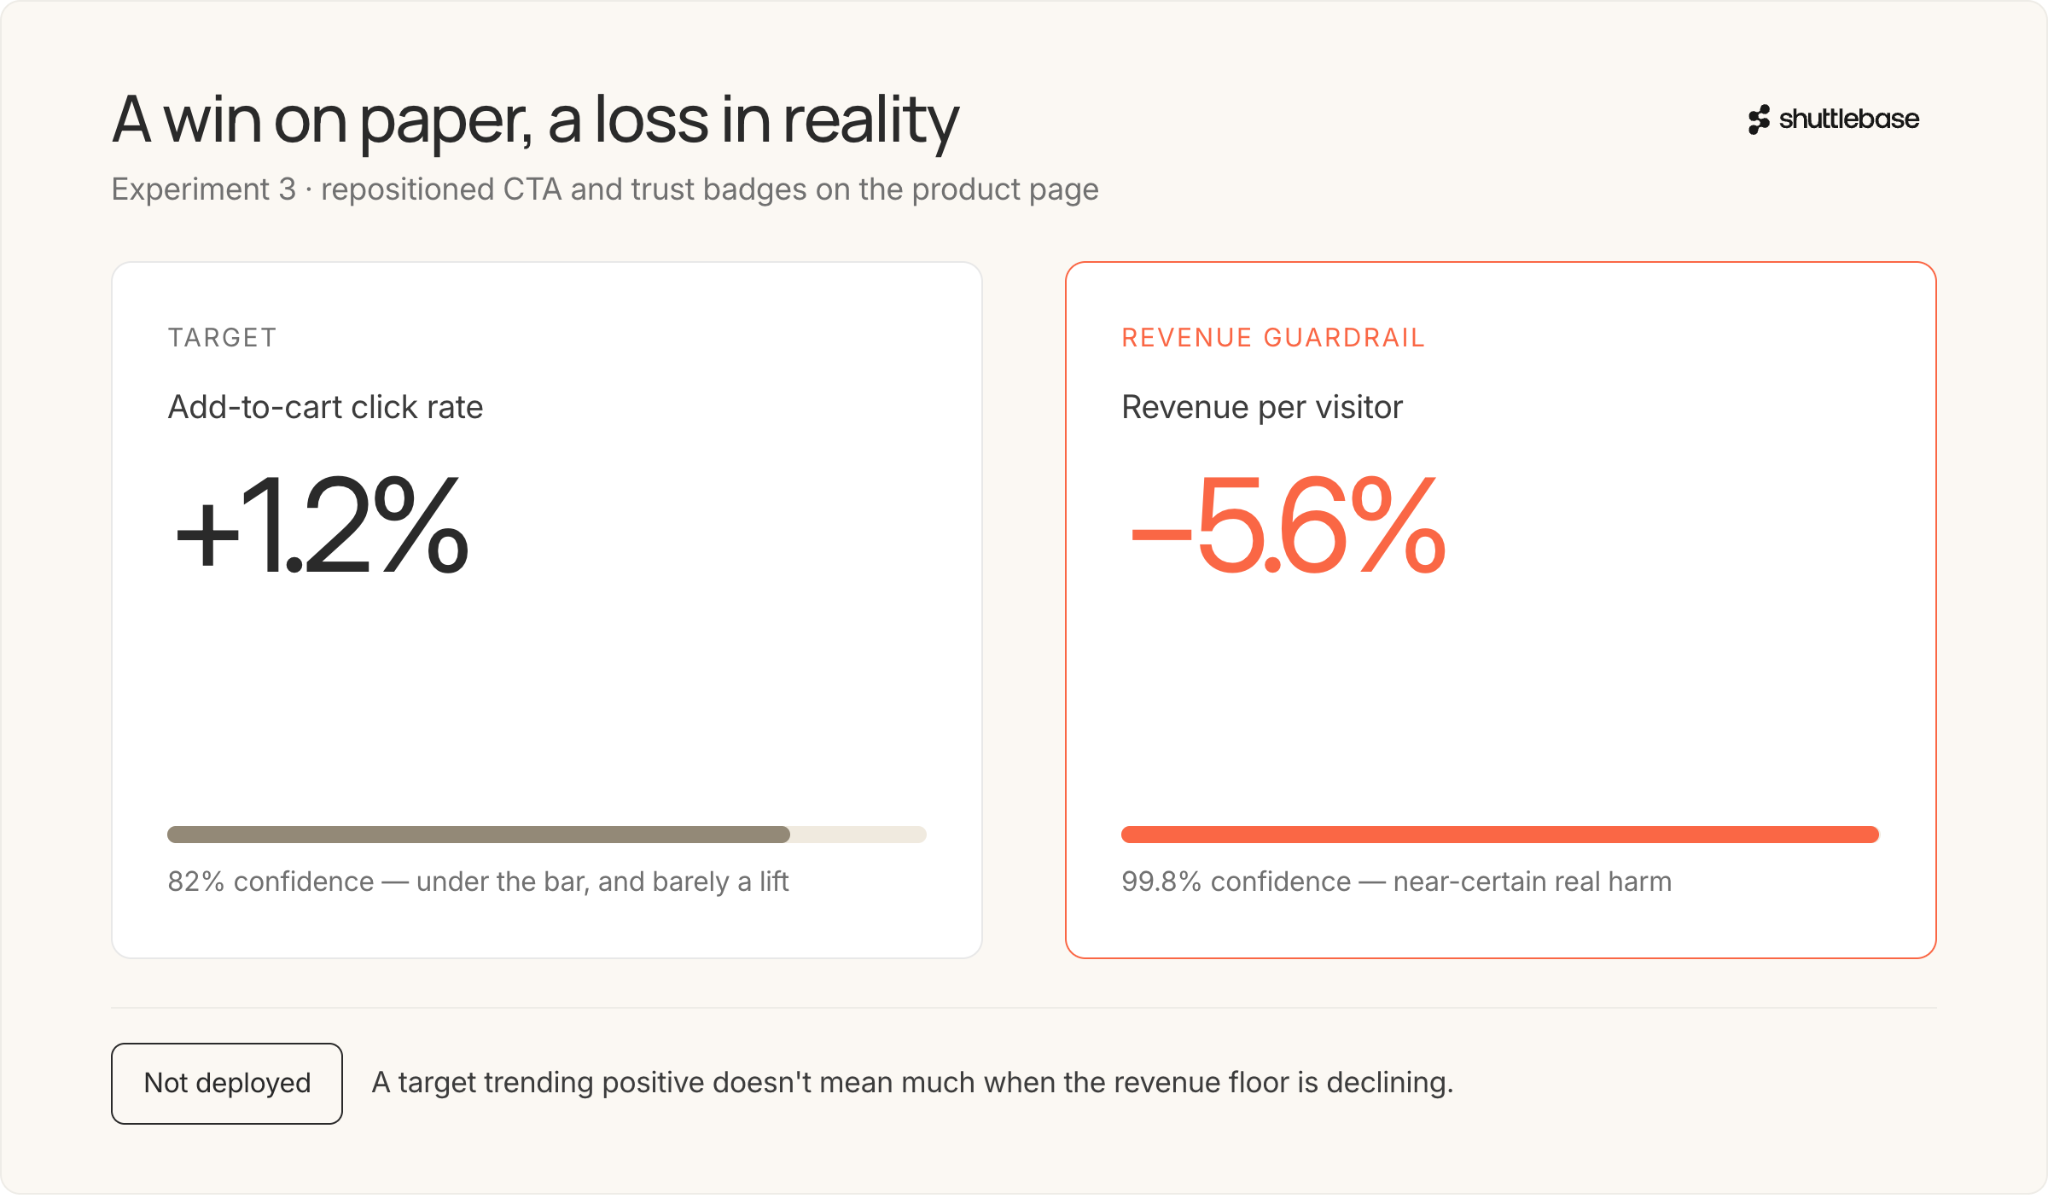
Experiment 3: Product page layout test (repositioned CTA + trust badges)
- Target metric: Add-to-cart click rate +1.2% (82% confidence)
- Revenue guardrail: Revenue per visitor −5.6% at 99.8% confidence
- Decision: Not deployed. The guardrail overruled the target. More visitors clicked "add to cart," but the 99.8% confidence on the revenue drop indicated near-certain real harm. The layout change likely disrupted the path from intent to purchase completion. A target metric trending positive doesn't mean much when the revenue floor is declining.
In cases like these, the target alone would call it a win, but the guardrail metric showed a decline in arguably the more important area, revenue. This is where supporting metrics do their work and make sure you ship only winning versions that improve your site.
How to choose A/B testing metrics
A/B testing works only when you set your metrics before the test runs. Deciding what metrics to track and how to measure them lets you judge the result against the goal you picked.
Here is what you should do before running a test, step by step:
- Pick a single target metric that's directly tied to your business goal. If your goal is to increase sales, use conversion rate. If it's to increase the value of each visitor, use revenue per visitor.
- List the supporting metrics that will help explain the result. Metrics like add-to-cart rate, product page views, checkout starts, and abandonment rate show where shoppers moved differently through the funnel if your target metric changes.
- Select two to four guardrail metrics. These are your "do no harm" metrics. They shouldn't get worse if the experiment succeeds. Common guardrails include page load time, bounce rate, return rate, refund rate, and customer support tickets.
- Define your success criteria before the test begins. Decide what counts as a win and which guardrail thresholds would make the experiment a failure. Setting these rules in advance prevents you from changing the criteria after seeing the results.
When you plan these metrics before the test, you can read the result honestly and make sure the changes you’re making after a test are going to improve, not hurt your site.
Reading the full picture to make the call
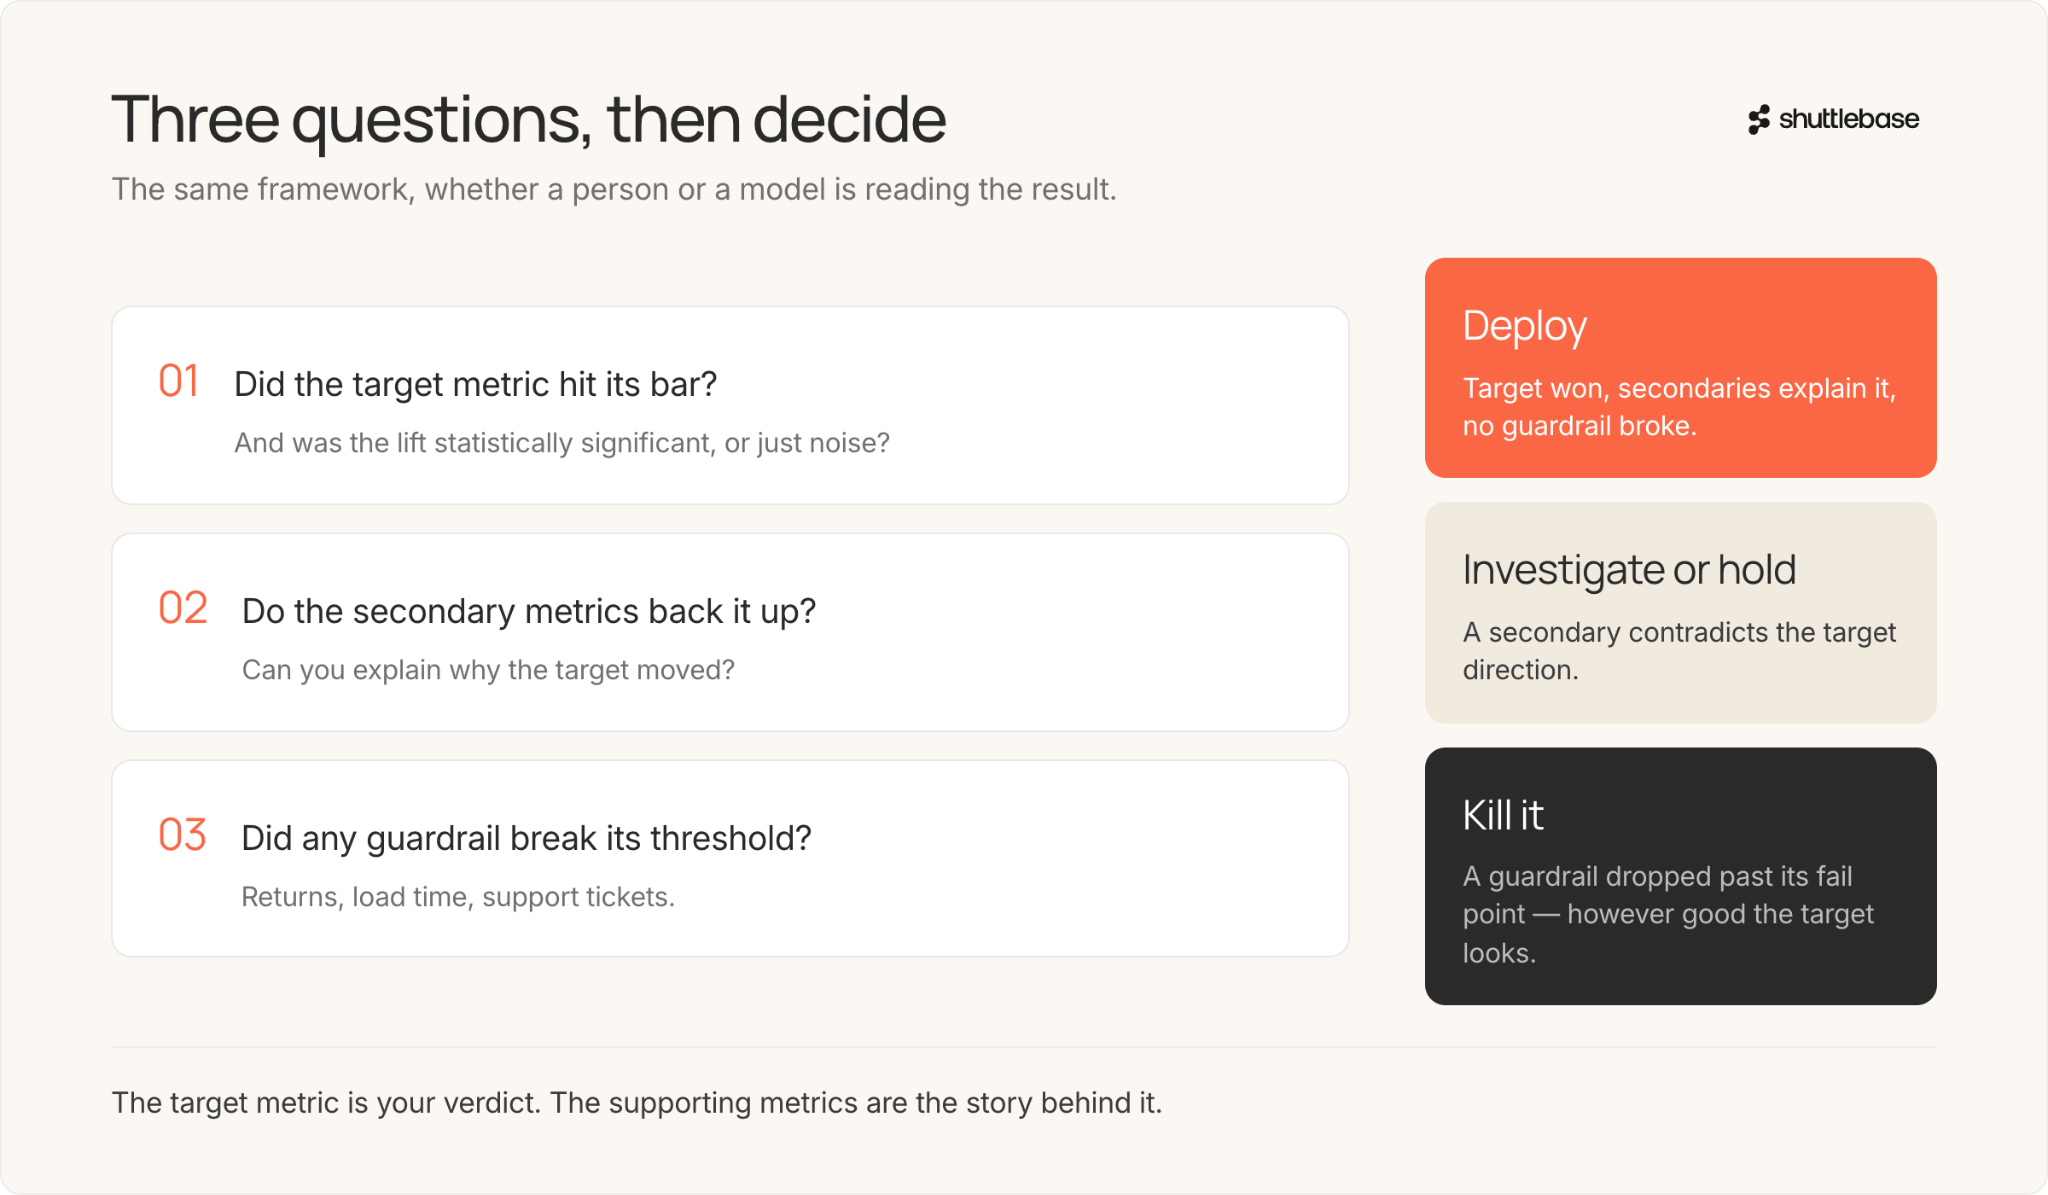
At the end of the day, the data will tell a story, and someone will have to make the go/no-go decision on whether to deploy. We have a very complicated algorithm and complex models that consider millions of data points to make these decisions, but we can boil them down to this framework.
- Did the target metric hit its bar? Did the one outcome you cared most about improve enough, and was the change statistically significant? Statistical significance tells you whether the lift is real or just noise.
- Do the secondary metrics back up the change? Can you explain why the target moved? Did a supporting metric move the same way, or was the shift possibly random or driven by a single outlier?
- Did any guardrail metrics break their threshold? Did a key guardrail, such as returns, load time, or support tickets, get worse than what you set as acceptable?
- Decide:
- Deploy the variant if the target won, secondary metrics explain the lift, and no guardrails broke.
- Investigate or hold if a secondary metric contradicts the target direction. If you have the time, keep testing. If it looks like it’s going nowhere, kill it and test something else.
- Kill the change if a guardrail drops past its fail point, no matter how good the target result looks.
If you follow these steps, you can explain to any teammate or executive both the result and the reason you made the call, backed by evidence.
Conclusion
Treat your A/B testing metrics as one system. The target metric is your verdict, and the supporting metrics are the story behind it. Judging a test by both is how you catch wins that last and avoid costly mistakes.
Tracking this full picture on every test is also what an autonomous optimization platform does for your store. Instead of weighing dozens of numbers by hand, you get a clear call of when a test is a real win, and when to wait.
.jpg)
.jpg)
.jpg)